CUAHSI-Hydrologic Information Systems
680 likes | 714 Vues
CUAHSI Hydrologic Information System aims to enhance data access, hydrologic observatories, science advancement, and education. Explore the network of hydrologic data sources and functions integrated through web services for a connected system.

CUAHSI-Hydrologic Information Systems
E N D
Presentation Transcript
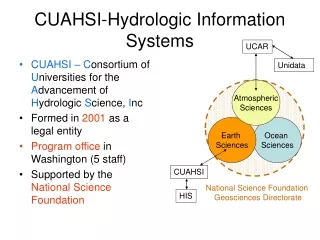
CUAHSI-Hydrologic Information Systems UCAR • CUAHSI –Consortium of Universities for the Advancement of Hydrologic Science, Inc • Formed in 2001 as a legal entity • Program office in Washington (5 staff) • Supported by the National Science Foundation Unidata Atmospheric Sciences Earth Sciences Ocean Sciences CUAHSI National Science Foundation Geosciences Directorate HIS
CUAHSI Member Institutions 115 Universities as of August 2006
CUAHSI Mission: To provide infrastructure and services to advance the development of hydrologic science and education
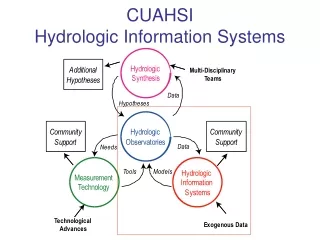
Common Vision: WATERS Network Informatics Observatories/ Environmental Field Facilities Sensors and Measurement Facility Synthesis A combined CLEANER-CUAHSI effort
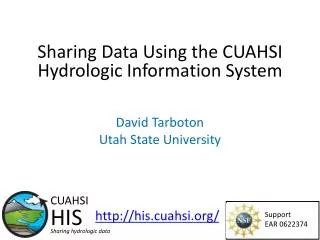
Definition The CUAHSI Hydrologic Information System (HIS) is a geographically distributed network of hydrologic data sources and functions that are integrated using web services so that they function as a connected whole.
Goals • better Data Access • support for Hydrologic Observatories • advancement of Hydrologic Science • enabling Hydrologic Education
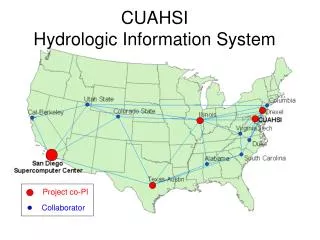
Project co-PI Collaborator CUAHSI HIS Project Team
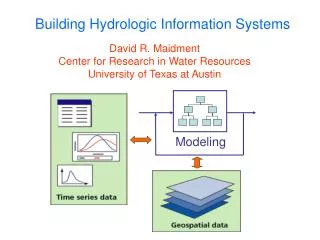
CUAHSI Hydrologic Information System Experiments Monitoring 1. Assemble data from many sources Information Sources Remote sensing GIS Climate models 2. Integrate data into a coherent structure Hydrologic Information Model Modeling, Analysis and Visualization 3. Do science Hypothesis testing Statistics Simulation Data Assimilation
HIS User Assessment • First survey done for HIS White Paper (2003) • HIS Symposium in March – 4 institutional surveys and a survey of participants • CUAHSI Web Surveyor – online questionnaire (75 responses from 38 institutions) • Summary paper
Please rank these four HIS service categories for helping you. Value Score (counting 4 for first, 4 for second, 2 for third and 1 for fourth). Conclusion: Data services are the highest priority
Which operating systems do you use for your research? If you use more than one operating system, select all that apply.
Please indicate one dataset that you believe would most benefit from increased ease of access through a Hydrologic Information System (HIS). Conclusion: EPA STORET Water Quality, Streamflow and Remote Sensing Data are perceived to be able to benefit from improved access. I am surprised USGS streamflow is up there. Is this an indication of importance over difficulty?
Which of the following data analysis difficulties are most important for HIS to address? Conclusion: High priorities are: - Data formats - Metadata - Irregular time steps Value Score (counting 3 for first, 2 for second and 1 for third).
How we use software (Web Surveyor) • Programming (85% of respondents): Fortran, C/C++, Visual Basic • Data Management (93%): Excel, MS Access • GIS (93%): ArcGIS • Mathematics/Statistics (98%): Excel, Matlab, SAS, variety of other systems • Hydrologic models (80%): Modflow, HEC models • A general, simple, standard, and open interface that could connect with many systems is the only way to accommodate all these
Water Data Water quantity and quality Soil water Rainfall & Snow Modeling Meteorology Remote sensing
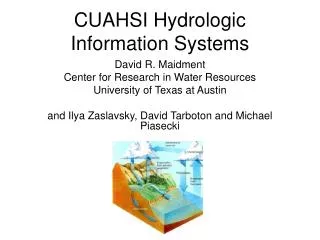
“Digital Watershed” How can hydrologists integrate observed and modeled data from various sources into a single description of the environment? A digital watershed is a synthesis of hydrologic observation data, geospatial data, remote sensing data and weather and climate data into a connected database for a hydrologic region
HDAS Web portal Interface Information input, display, query and output services Preliminary data exploration and discovery. See what is available and perform exploratory analyses 3rd party servers Web services interface e.g. USGS, NCDC GIS Matlab Observatory servers IDL SDSC HIS servers Splus, R Excel Programming (Fortran, C, VB) Downloads Uploads HTML -XML Data access through web services WaterOneFlow Web Services WSDL - SOAP Data storage through web services
Applications and Services Web application: Data Portal • Your application • Excel, ArcGIS, Matlab • Fortran, C/C++, Visual Basic • Hydrologic model • ……………. • Your operating system • Windows, Unix, Linux, Mac Internet Web Services Library
CUAHSI Hydrologic Data Access System http://river.sdsc.edu/HDAS NCDC NASA EPA NWS Observatory Data USGS Arc Hydro Server will be a customization of ArcGIS Server 9.2 for serving water observational data A common data window for accessing, viewing and downloading hydrologic information
Data Sources NASA Storet Ameriflux Unidata NCDC Extract NCAR NWIS Transform CUAHSI Web Services Excel Visual Basic ArcGIS C/C++ Load Matlab Fortran Access Java Applications http://www.cuahsi.org/his/ Some operational services
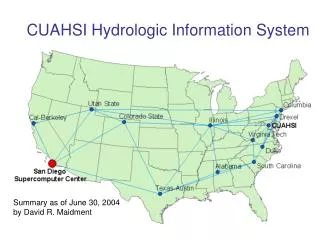
Workgroup HIS – research group or observatory CUAHSI Hydrologic Information System Levels National HIS – San Diego Supercomputer Center Map interface, observations catalogs and web services for national data sources;integration of information from workgroups HIS Server Map interface, observations catalogs and web services for regional data sources; observations databases and web services for individual investigator data Personal HIS – an individual hydrologic scientist HIS Analyst Application templates and HydroObjects for direct ingestion of data into analysis environments: Excel, ArcGIS, Matlab, programming languages; MyDB for storage of analysis data
Supports data discovery, delivery and publication Data discovery – how do I find the data I want? Map interface and observations catalogs Metadata based Search Data delivery – how do I acquire the data I want? Use web services or retrieve from local database Data Publication – how do I publish my observation data? Use Observations Data Model HIS Server
Observations Catalog Specifies what variables are measured at each site, over what time interval, and how many observations of each variable are available
Map front end – ArcGIS Server 9.2 (being programmed by ESRI Water Resources for CUAHSI) Relational database – SQL/Server 2005 or Express Web services library – VB.Net programs accessed as a Web Service Description Language (WSDL) HIS Server Architecture
National and Workgroup HIS National HIS Workgroup HIS National HIS has a polygon in it marking the region of coverage of a workgroup HIS server Workgroup HIS has local observations catalogs for coverage of national data sources in its region. These local catalogs are partitioned from the national observations catalogs. For HIS 1.0 the National and Workgroup HIS servers will not be dynamically connected.
Hydrologic Science It is as important to represent hydrologic environments precisely with data as it is to represent hydrologic processes with equations Physical laws and principles (Mass, momentum, energy, chemistry) Hydrologic Process Science (Equations, simulation models, prediction) Hydrologic conditions (Fluxes, flows, concentrations) Hydrologic Information Science (Observations, data models, visualization Hydrologic environment (Dynamic earth)
Continuous Space-Time Model – NetCDF (Unidata) Time, T Coordinate dimensions {X} D Space, L Variable dimensions {Y} Variables, V
Discrete Space-Time Data ModelArcHydro Time, TSDateTime TSValue Space, FeatureID Variables, TSTypeID
HydroVolumes Take a watershed and extrude it vertically into the atmosphere and subsurface A hydrovolume is “a volume in space through which water, energy and mass flow, are stored internally, and transformed”
Watershed Hydrovolumes Hydrovolume Geovolume is the portion of a hydrovolume that contains solid earth materials USGS Gaging stations
Value Time Geospatial Time Series Time Series Properties (Type) A Value-Time array A time series that knows what geographic feature it describes and what type of time series it is Shape
Terrain Data Models Grid TIN Contour and flowline
Neuse Basin: Coastal aquifer system Section line Beaufort Aquifer * From USGS, Water Resources Data Report of North Carolina for WY 2002
Neuse Groundwater Geovolumes of hydrogeologic units from US Geological survey (GMS)
Create a 3 dimensional representation Geovolume Each cell in the 2D representation is transformed into a 3D object Geovolume with model cells
Numerical Models Prediction HSPF Sensor Arrays NGDC NWS NCDC USGS NWIS NCEP Air-Q MM5 Individual Samples Data Centers Page 3 The Demands METADATA Drexel University, College of Engineering
Upper Hydrologic Ontology Hydrologic ProcessesSedimentation Many More Many More Many More Many More ARCHydro ISO 19115 Geospatial ISO 19108 Temporal Objects ISO 19103 Units/Conversion USGS Hydrologic Unit Code Page 21 Hydrologic Metadata We currently have What we need is Michael Piasecki is our expert in this subject! Ontology Examples Drexel University, College of Engineering
A relational database stored in Access, PostgreSQL, SQLServer, …. Stores observation data made at points Access data through web interfaces Fill using automated data harvesting CUAHSI Observations Data Model Streamflow Groundwater levels Precipitation & Climate Soil moisture data Water Quality Flux tower data
Purposes • Hydrologic Observations Data System to Enhance • Retrieval • Integrated Analysis • Multiple Investigators • Standard and Scalable Format for Sharing • Ancillary information (metadata) to allow unambiguous interpretation and use – incorporating uncertainty • Traceable heritage from raw measurements to usable information – quality control levels Premise • A relational database at the single observation level (atomic model) • Querying capability • Cross dimension retrieval and analysis
Community Design Requirements(from comments of 22 reviewers) • Incorporate sufficient metadata to identify provenance and give exact definition of data for unambiguous interpretation • Spatial location of measurements • Scale of measurements • Depth/Offset Information • Censored data • Classification of data type to guide appropriate interpretation • Continuous • Indication of gaps • Indicate data quality
Scale issues in the interpretation of data The scale triplet a) Extent b) Spacing c) Support From: Blöschl, G., (1996), Scale and Scaling in Hydrology, Habilitationsschrift, Weiner Mitteilungen Wasser Abwasser Gewasser, Wien, 346 p.
Hydrologic Observations Data Model What are the basic attributes to be associated with each single observation and how can these best be organized? Data Source and Network Controlled Vocabulary Tables Sites Variables Values Metadata e.g. mg/kg, cfs e.g. depth Streamflow Depth of snow pack Landuse, Vegetation e.g. Non-detect,Estimated, Windspeed, Precipitation A data source operates an observation network A network is a set of observation sites A site is a point location where one or more variables are measured A variable is a property describing the flow or quality of water A value is an observation of a variable at a particular time Metadata provide information about the context of the observation. Data Delivery Data Discovery See http://www.cuahsi.org/his/documentation.html Ernest To Center for Research in Water Resources University of Texas at Austin 20061011
Feature Hydrologic Observations Data Model Waterbody Watershed HydroPoint HydroID HydroID HydroID HydroCode HydroCode HydroCode * FType DrainID FType Name AreaSqKm Name AreaSqKm JunctionID JunctionID JunctionID NextDownID * * ComplexEdgeFeature SimpleJunctionFeature CouplingTable SiteID (GUID) HydroID (Integer) HydroEdge HydroJunction HydroJunction HydroJunction 1 HydroID 1 HydroID HydroID HydroID HydroCode HydroCode HydroCode HydroCode ReachCode NextDownID NextDownID NextDownID Name LengthDown LengthDown LengthDown LengthKm HydroNetwork DrainArea DrainArea DrainArea LengthDown FType FType FType FlowDir Enabled Enabled Enabled FType AncillaryRole AncillaryRole AncillaryRole EdgeType Enabled EdgeType Flowline Shoreline Independent of, but coupled to Geographic Representation Arc Hydro HODM 1 MonitoringPoint 1 SiteID SiteCode SiteName OR Latitude Longitude … 1 1
Slope Elevation Mean annual flow Corresponding velocity Drainage area % of upstream drainage area in different land uses Stream order NHDPlus as a starting point for geographic representation