Download
1 / 27
290 likes | 716 Vues
Blood cholesterol and vascular mortality by age, sex and blood pressure: a meta-analysis of individual data from 61 prospective studies with 55 000 vascular deaths. Lancet 2007; 370: 1829-39. Prospective Studies Collaboration .

E N D
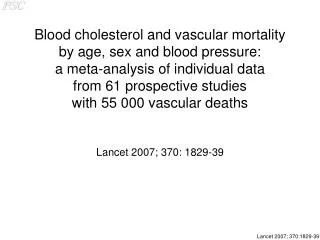
Blood cholesterol and vascular mortality by age, sex and blood pressure:a meta-analysis of individual datafrom 61 prospective studieswith 55 000 vascular deaths Lancet 2007; 370: 1829-39
Prospective Studies Collaboration • Established chiefly to investigate associations of blood pressure and cholesterol with cause-specific mortality • Individual data on 900 000 participants without any previous history of vascular disease from 61 prospective cohort studies • > 55 000 vascular deaths (34 000 ischaemic heart disease [IHD], 12 000 stroke, 10 000 other) • 150 000 participants from 23 studies also had HDL cholesterol (5000 vascular deaths)
Collaborators and investigators Atherosclerosis Risk in Communities (ARIC): L Chambless; Belgian Inter-university Research on Nutrition and Health (BIRNH): G De Backer, D De Bacquer, M Kornitzer; British Regional Heart Study (BRHS): P Whincup, SG Wannamethee, R Morris; British United Provident Association (BUPA):N Wald, J Morris, M Law; Busselton: M Knuiman, H Bartholomew; Caerphilly and Speedwell: G Davey Smith, P Sweetnam, P Elwood, J Yarnell; Cardiovascular Health Study (CHS): R Kronmal; CB Project: D Kromhout; Charleston: S Sutherland, J Keil; Copenhagen City Heart Study: G Jensen, P Schnohr; Evans County: C Hames (deceased), A Tyroler; Finnish Mobile Clinic Survey (FMCS): A Aromaa, P Knekt, A Reunanen; Finrisk: J Tuomilehto, P Jousilahti, E Vartiainen, P Puska; Flemish Study on Environment, Genes and Health (FLEMENGHO): T Kuznetsova, T Richart, J Staessen, L Thijs; Research Centre for Prevention and Health (Glostrup Population Studies): T Jorgensen,T Thomsen; Honolulu Heart Program: D Sharp, JD Curb; Ikawa, Noichi and Kyowa: H Iso, S Sato, A Kitamura, Y Naito; Imperial College, London and Oxon Clinical Epidemiology Limited: N Qizilbash; Centre d'Investigations Preventives et Cliniques (IPC), Paris: A Benetos, L Guize; Israeli Ischaemic Heart Disease Study: U Goldbourt; Japan Railways: M Tomita, Y Nishimoto, T Murayama; Lipid Research Clinics Follow-up Study (LRC): M Criqui, C Davis; Midspan Collaborative Study: C Hart, G Davey-Smith, D Hole, C Gillis; Minnesota Heart Health Project (MHHP) and Minnesota Heart Survey (MHS): D Jacobs, H Blackburn, R Luepker; Multiple Risk Factor Intervention Trial (MRFIT): J Neaton, L Eberly; First National Health and Nutrition Examination Survey Epidemiologic Follow-up Study (NHEFS): C Cox; NHLBI Framingham Heart Study: D Levy, R D'Agostino, H Silbershatz; Norwegian Counties Study: A Tverdal, R Selmer; Northwick Park Heart Study (NPHS): T Meade, K Garrow, J Cooper; Nurses’ Health Study: F Speizer, M Stampfer; Occupational Groups (OG), Rome: A Menotti, A Spagnolo; Ohasama: I Tsuji, Y Imai, T Ohkubo, S Hisamichi; Oslo: L Haheim, I Holme, I Hjermann, P Leren; Paris Prospective Study: P Ducimetiere, J Empana; Perth: K Jamrozik, R Broadhurst; Prospective Cardiovascular Munster Study (PROCAM): G Assmann, H Schulte; Prospective Study of Women in Gothenburg: C Bengtsson, C Björkelund, L Lissner; Puerto Rico Health Heart Program (PRHHP): P Sorlie, M Garcia-Palmieri; Rancho Bernado: E Barrett-Connor, M Criqui, R Langer; RenfrewandPaisley study: C Hart, G Davey Smith, D Hole; Saitama Cohort Study: K Nakachi, K Imai; Seven Cities China: X Fang, S Li; Seven Countries (SC) Croatia: R Buzina; SC Finland: A Nissinen; SC Greece (Greek Islands Study): C Aravanis, A Dontas, A Kafatos; SC Italy: A Menotti; SC Japan: H Adachi, H Toshima, T Imaizumi; SC Netherlands: D Kromhout; SC Serbia: S Nedeljkovic, M Ostojic; Shanghai: Z Chen; Scottish Heart Health Study (SHHS): H Tunstall-Pedoe; Shibata: T Nakayama, N Yoshiike, T Yokoyama, C Date, H Tanaka; Tecumseh: J Keller; Tromso: K Bonaa, E Arnesen; United Kingdom Heart Disease Prevention Project (UKHDPP): H Tunstall-Pedoe; US Health Professionals Follow-up Study: E Rimm; US Physicians’ Health Study: M Gaziano, JE Buring, C Hennekens; Värmland: S Törnberg, J Carstensen; Whitehall: M Shipley, D Leon, M Marmot; Clinical Trial Service Unit (CTSU): J Armitage, C Baigent, Z Chen, R Clarke, R Collins, J Emberson, J Halsey, M Landray, S Lewington, A Palmer (deceased), S Parish, R Peto, P Sherliker, G Whitlock. Steering Committee — S Lewington (coordinator and statistician), S MacMahon (chair), R Peto (statistician), A Aromaa, C Baigent, J Carstensen, Z Chen, R Clarke, R Collins, S Duffy, D Kromhout, J Neaton, N Qizilbash, A Rodgers, S Tominaga, S Törnberg, H Tunstall-Pedoe, G Whitlock.
Analysis • Cox regression adjusted for age, sex & study • Hazard ratios are presented as floating absolute risks (does not alter values but adds appropriate confidence interval to every group, including even reference group) • Adjustment for regression dilution bias makes relationship with usual values about 50% steeperthan that with measured values
256 128 64 32 16 Hazard ratio (floating absolute risks & 95% CI) 8 4 2 1 0·5 4·0 5·0 6·0 7·0 8·0 Usual total cholesterol (mmol/L) IHD mortality (33 744 deaths) versus usual total cholesterol Age at risk 1 mmol/L total cholesterol 15% risk 80-89 18% risk 70-79 28% risk 60-69 42% risk 50-59 56% risk 40-49
Age at risk Sex No. of deaths 80-89 Men 2919 Women 2707 0·85 (0·82-0·89) Total 5626 70-79 Men 7372 Women 3457 Total 10 829 0·82 (0·80-0·85) 60-69 Men 8594 Women 1825 Total 10 419 0·72 (0·69-0·74) 50-59 Men 5001 Women 560 Total 5561 0·58 (0·56-0·61) 40-49 Men 1191 Women 118 Total 1309 0·44 (0·42-0·48) 0·4 0·6 0·8 1·0 Hazard ratio (& 95% CI) for 1 mmol/L lower usual total cholesterol IHD mortality (33 744 deaths) versus usual total cholesterolby age and sex
Age at risk SBP (mmHg) No. of deaths 70-89 165+ 7634 0·82 (0·79-0·84) 145-164 4645 0·79 (0·76-0·82) <145 4176 0·76 (0·73-0·79) 60-69 165+ 3174 0·81 (0·78-0·84) 145-164 3027 0·73 (0·70-0·76) <145 4218 0·68 (0·65-0·70) 40-59 165+ 1364 0·66 (0·62-0·70) 145-164 1908 0·62 (0·59-0·65) <145 3598 0·53 (0·51-0·55) 0·4 0·6 0·8 1·0 Hazard ratio (& 95% CI) for mmol/L lower usual total cholesterol IHD mortality (33 744 deaths) versus usual total cholesterolby baseline SBP
Age at risk Smoking status No. of deaths 70-89 2730 Current cig 0·74 (0·71-0·78) Other 11 168 0·80 (0·78-0·82) 2557 Never smoker 0·77 (0·74-0·81) 60-69 3911 Current cig 0·70 (0·68-0·73) Other 5170 0·71 (0·68-0·74) 1338 Never smoker 0·71 (0·67-0·76) 40-59 3612 Current cig 0·58 (0·56-0·60) Other 2608 0·54 (0·52-0·57) 650 0·59 (0·54-0·64) Never smoker 0·6 0·8 1·0 0·4 Hazard ratio (& 95% CI) for 1 mmol/L lower usual total cholesterol IHD mortality (33 744 deaths) versus usual total cholesterolby smoking status
Age at risk BMI (kg/m2) No. of deaths 70-89 30+ 2369 0·77 (0·73-0·81) 25-29 7198 0·78 (0·75-0·80) <25 6736 0·79 (0·76-0·81) 60-69 30+ 1518 0·74 (0·70-0·79) 25-29 4679 0·72 (0·69-0·74) <25 4123 0·70 (0·68-0·73) 40-59 30+ 827 0·62 (0·57-0·67) 25-29 3105 0·56 (0·54-0·59) <25 2881 0·55 (0·53-0·58) 0·4 0·6 0·8 1·0 Hazard ratio (& 95% CI) for 1 mmol/L lower usual total cholesterol IHD mortality (33 744 deaths) versus usual total cholesterolby BMI
1.33 units total/HDL 128 31% 70-89 years 70-89 years 64 32 70-89 years 60-69 40% 60-69 16 Hazard ratio (floating absolute risks & 95% CI) 8 40-59 44% 60-69 40-59 4 2 1 40-59 0·5 1·0 1·5 3 4 5 6 3 4 5 6 7 Usual HDL (mmol/L) Usual non-HDL (mmol/L) Usual total/HDL IHD mortality (3020 deaths) versus usual(a) HDL cholesterol; (b) non-HDL cholesterol; and (c) total/HDL cholesterolby age at risk
128 Age at risk: 0.33 mmol/L HDL 64 70-89 35% risk 32 16 8 Hazard ratio (floating absolute risks & 95% CI) 83% risk 60-69 4 2 1 40-59 63% risk 0·5 1·0 1·5 Usual HDL cholesterol (mmol/L) IHD mortality (3020 deaths) versus usual HDL cholesterol
Age at risk: 1 mmol/L non-HDL 128 70-89 27% risk 64 32 60-69 34% risk 16 8 Hazard ratio (floating absolute risks & 95% CI) 40-59 43% risk 4 2 1 0·5 3 4 5 6 Usual non-HDL cholesterol (mmol/L) IHD mortality (3020 deaths) versus usual non-HDL cholesterol
Age at risk 1.33 total/HDL 70-89 31% risk 128 64 40 risk 60-69 32 16 Hazard ratio (floating absolute risks & 95% CI) 8 40-59 44% risk 4 2 1 0·5 3 4 5 6 7 Usual total/HDL cholesterol IHD mortality (3020 deaths) versus usual total/HDL cholesterol
64 Age at risk: HR (95% CI) per 1mmol/L 80-89 1.10 (1.05-1.16) 32 16 70-79 1.15 (1.09-1.20) 8 Hazard ratio (floating absolute risks & 95% CI) 4 60-69 0.94 (0.90-0.99) 2 40-59 0.84 (0.78-0.91) 1 4·0 5·0 6·0 7·0 8·0 Usual total cholesterol (mmol/L) Stroke mortality (11 663 deaths) versus usual total cholesterol by age
Stroke subtype Age at risk No. of deaths Total stroke 80-89 2632 1·06 (1·00-1·13) 70-79 4311 1·04 (0·99-1·09) 60-69 2938 1·02 (0·97-1·08) Test for trend: 12 = 9.3 (P=0.002) 40-59 1782 0·90 (0·84-0·97) Haemorrhagic stroke 80-89 422 1·06 (0·90-1·25) 70-79 915 1·18 (1·06-1·31) 60-69 743 1·09 (0·97-1·23) Test for trend: 12 = 4.3 (P=0.04) 40-59 620 0·92 (0·81-1·04) Ischaemic stroke 80-89 519 1·09 (0·95-1·26) 70-79 850 1·06 (0·95-1·17) 60-69 540 0·89 (0·79-1·01) Test for trend: 12 = 15.1 (P=0.0001) 40-59 225 0·73 (0·61-0·87) 0·6 0·8 1·0 1·2 1·4 Hazard ratio (& 95% CI) for 1 mmol/L lower usual total cholesterol Stroke mortality (11 663 deaths) versus usual total cholesterolby type and age
8 Baseline SBP (mmHg): 1 mmol/L total cholesterol 185+ 10% risk 4 Hazard ratio (floating absolute risks & 95% CI) 15% risk 165-184 2 145-164 7% risk <145 42% risk 1 4·0 5·0 6·0 7·0 8·0 Usual total cholesterol (mmol/L) Stroke mortality (11 663 deaths) versus usual total cholesterolby baseline SBP
Stroke subtype SBP (mmHg) No. of deaths Total stroke 185+ 2473 1·10 (1·05-1·16) 165-184 2498 1·15 (1·09-1·20) 145-164 3092 1·07 (1·02-1·12) 125-144 2562 0·94 (0·90-0·99) Test for trend:12 = 53·2 (p<0·0001) <125 1038 0·84 (0·78-0·91) Haemorrhagic stroke 185+ 662 1·16 (1·05-1·27) 165-184 631 1·30 (1·18-1·43) 145-164 674 1·12 (1·03-1·23) 125-144 528 1·01 (0·90-1·13) <125 205 0·83 (0·71-0·98) Test for trend: 12 = 15·7 (p=0·0001) Ischaemic stroke 185+ 476 0·99 (0·89-1·11) 165-184 439 1·13 (1·01-1·26) 145-164 574 1·00 (0·91-1·11) 125-144 433 0·92 (0·82-1·03) Test for trend: 12 = 8.9 (p=0·003) <125 212 0·78 (0·67-0·90) 0·6 0·8 1·0 1·4 1·2 Stroke mortality (16 497 deaths) versus usual total cholesterolby baseline SBP Hazard ratio (& 95% CI) for 1 mmol/L lower usual total cholesterol
128 HR (95%CI) per 1.33 total/HDL 64 32 70-89 years 70-89 70-89 70-89 years 70-89 years 70-89 0.95 (0.83-1.10) 16 8 Hazard ratio (floating absolute risks & 95% CI) 4 2 40-69 40-69 0.86 (0.74-0.99) 1 40-69 40-69 40-69 40-69 0·5 3 4 5 6 1·0 1·5 3 4 5 6 7 Usual non-HDL (mmol/L) Usual HDL (mmol/L) Usual total/HDL Stroke mortality (914 deaths) versus usual:(a) HDL cholesterol; (b) non-HDL cholesterol; and (c) total/HDL cholesterol
128 HR (95%CI) per 0.33 mmol/L HDL 64 32 70-89 years 1.02 (0.88-1.17) 16 8 Hazard ratio (floating absolute risks & 95% CI) 4 2 40-69 years 1.04 (0.89-1.23) 1 0·5 1·0 1·5 Usual HDL (mmol/L) Stroke mortality (914 deaths) versus usual HDL cholesterol
128 HR (95%CI) per 1 mmol/L non-HDL 64 32 70-89 years 1.05 (0.91-1.20) 16 8 Hazard ratio (floating absolute risks & 95% CI) 4 2 40-69 years 0.96 (0.83-1.12) 1 0·5 3 4 5 6 Usual non-HDL (mmol/L) Stroke mortality (914 deaths) versus usual non-HDL cholesterol
128 HR (95%CI) per 1.33 total/HDL 64 32 70-89 years 0.95 (0.83-1.10) 16 8 Hazard ratio (floating absolute risks & 95% CI) 4 2 40-69 years 0.86 (0.74-0.99) 1 0·5 3 4 5 6 7 Usual total/HDL Stroke mortality (914 deaths) versus usual total/HDL cholesterol
Conclusions:Total cholesterol & IHD mortality • Total cholesterol is a major risk factor for IHD both in middle and in old age • There is no threshold level of total cholesterol in the range commonly occurring in Western populations below which lower cholesterol is not associated with lower IHD mortality • There are no important sex differences in the relative effects of total cholesterol on vascular mortality • The joint relative effects of total cholesterol and blood pressure are approximately additive (rather than multiplicative)
Conclusions:HDL, non-HDL cholesterol & IHD mortality • The joint relative effects of HDL and non-HDL cholesterol are approximately independent and additive • HDL cholesterol adds worthwhile predictive information beyond either total or non-HDL cholesterol • The ratio of total/HDL cholesterol is statistically twice as informative as total cholesterol alone
Conclusions:Total cholesterol & stroke mortality • A positive relationship with ischaemic and total stroke mortality was seen only in middle age and only in those with below-average blood pressure • At older ages and, particularly, for those with systolic blood pressure over about 145 mm Hg, total cholesterol was negatively related to haemorrhagic and total stroke mortality • There is conclusive evidence from randomised trials that statins substantially reduce stroke rates in a wide range of patients • The contrast between these statistically reliable observational epidemiological results and the statistically reliable randomised trial results is substantial and invites further research
Baseline SBP (mmHg): 8 185+ 165-184 145-164 4 <145 Hazard ratio (floating absolute risks & 95% CI) 2 1 4·0 5·0 6·0 7·0 8·0 Usual total cholesterol (mmol/L) IHD mortality (33 744 deaths) versus usual total cholesterol by SBP
IHD mortality (3020 deaths) versus:usual HDL cholesterol by baseline non-HDL cholesterolusual non-HDL cholesterol by baseline HDL cholesterol Baseline HDL (mmol/L) <1·25 <1·25 4 1·25+ 1·25+ Hazard ratio (floating absolute risks & 95% CI) 2 Baseline non-HDL (mmol/L) 5+ 5+ 1 <5 <5 0·5 1·0 1·5 3·0 4·0 5·0 6·0 Usual HDL cholesterol (mmol/L) Usual non-HDL cholesterol (mmol/L)