
PDPN Expression Rates in Cultured CAFs: Impact of Trypsin/EDTA Treatment Duration
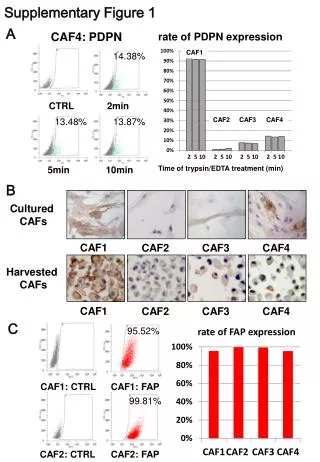
This supplementary figure illustrates the rates of PDPN expression among various cultured cancer-associated fibroblasts (CAFs) after different treatment durations with trypsin/EDTA. The analysis includes four CAF samples (CAF1, CAF2, CAF3, and CAF4) showcasing varying percentages of PDPN expression at specified time intervals. Results indicate the effect of trypsin treatment on PDPN levels, with notable differences between samples and treatment durations, allowing for a deeper understanding of fibroblast behavior in tumor microenvironments.

PDPN Expression Rates in Cultured CAFs: Impact of Trypsin/EDTA Treatment Duration
E N D
Presentation Transcript
Supplementary Figure 1 A rate of PDPN expression CAF4: PDPN 13.48% 14.38% CAF1 Time of trypsin/EDTA treatment (min) B Cultured CAFs CTRL 2min 13.87% CAF2 CAF3 CAF4 CAF1 CAF3 CAF4 CAF2 Harvested CAFs 5min 10min CAF1 CAF3 CAF4 CAF2 C 95.52% CAF1: CTRL CAF1: FAP 99.81% CAF2: CTRL CAF2: FAP


