Lecture 9: Rocks and Minerals
290 likes | 686 Vues
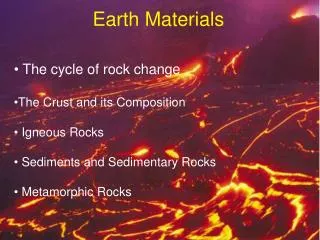
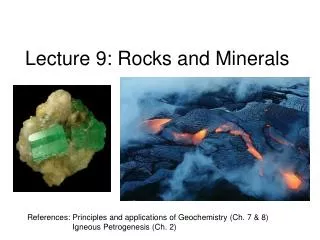
Lecture 9: Rocks and Minerals. References: Principles and applications of Geochemistry (Ch. 7 & 8) Igneous Petrogenesis (Ch. 2). How are rocks formed: the rock cycle. www.geolsoc.org.uk. Granite: intrusive igneous rock. quartz. hornblende. feldspar. What defines a mineral?.

Lecture 9: Rocks and Minerals
E N D
Presentation Transcript
Lecture 9: Rocks and Minerals References: Principles and applications of Geochemistry (Ch. 7 & 8) Igneous Petrogenesis (Ch. 2)
How are rocks formed: the rock cycle www.geolsoc.org.uk
Granite: intrusive igneous rock quartz hornblende feldspar
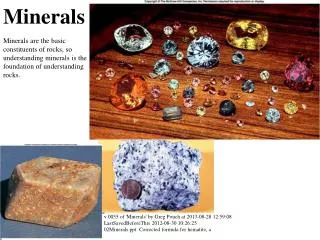
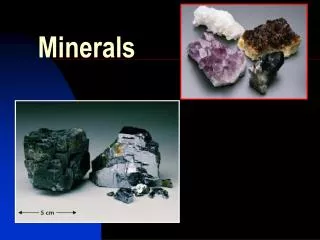
What defines a mineral? • Naturally Occurring • Inorganic • Solid • Specific composition (e.g., Gold - Au, Salt - NaCl, quartz - SiO2) • Definite crystalline structure – atoms are arranged in a specific pattern
Mineral Identification • Colour: caused by trace elements or impurities within a mineral • Lustre: how a mineral surface reflects light • Texture: how the mineral feels to the touch • Streak: the colour of a mineral when it is scratched on a streak plate (i.e., colour when broken up) • Hardness (Moh’s scale: 1-10 – diamond is 10, talc is 1) • Cleavage: how a mineral breaks (typically along planes of weakness – related to bonding • Fracture: splitting with no orientation • Density • Flame: colour under a flame • Special properties like double refraction, radioactivity, taste, pleochroism, fluorescence
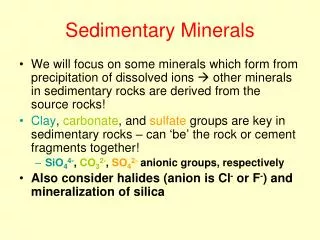
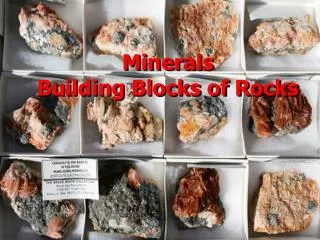
Mineral groups 1) Silicates (SiO4) – make up 96% of minerals, e.g., olivine 2) Carbonates (CO3): e.g, calcite CaCO3 3) Oxides: metal and oxygen (e.g., hematite, magnetite) 4) Sulfides: element + S2 (pyrite – FeS) 5) Sulfates: element + SO4 (gypsum – CaSO4nH2O) 6) Halides: element + halide (salt - NaCl) 7) Native elements: e.g., Cu, Au, Ag pyrite gypsum
Crystal Habit • appearance – shape and size of crystals stibnite hematite Dendritic: tree-like Botryoidal: grape-like Bladed
Crystal Form Any grouping of crystal faces or facets that are arranged in the same symmetry is referred to as a crystal's "form." There are approximately 48 unique crystal forms.
Atomic structure of crystals The relative size of ions determine how atoms pack and which ions can serve as substitutes.
Crystal structure: • determined by radius size…
Silicates O2- Silicate tetrahedron olivine, quartz Si4+ Single chain structure pyroxene O2- O2- O2- Double chain structure hornblende SiO44-: although it is geometrically balanced, it is not charge balanced – needs ions or other tetrahedra to balance charge Sheet silicate structure micas Framework silicate structure Feldspars
How are minerals formed? • Solution: if a solution is supersaturated, minerals will precipitate • Magma: minerals form during cooling of a magma – the slower a magma cools, the larger the crystals Intrusive: cools slowly beneath Earth’s surface (e.g., basalt) Extrusive: cools rapidly at Earth’s surface (e.g., granite)Metamorphism • Metamorphism: transformation due to changes in pressure and temperature
Phase Diagrams A phase diagram is common way to represent the various phases of a substance and the conditions under which each phase exists. A phase diagram is a plot of pressure (P ) vs temperature (T). Lines on the diagram represent conditions (T,P) under which a phase change is at equilibrium. That is, at a point on a line, it is possible for two (or three) phases to coexist at equilibrium. In other regions of the plot, only one phase exists at equilibrium. Phase diagram for water Triple point: where 3 phases coexist
Binary phase diagram for a solid solution of Olivine Solidus: the temperature below which the substance is stable in the solid state Liquidus: the temperature above which the substance is stable in the liquid state Lever Rule: to determine quantitatively the relative composition of a mixture in a two-phase region in a phase diagram fsolid fliq Fayallite (Fa) % Fo (Mg2SiO4) Forsterite (Fo)
Magma: mixture of molten rock, gases and mineral phases, produced by mantle melting Mantle melts between ~800-1250ºC due to: • Increase in temperature • Decrease in pressure • Addition of volatile phases Upwelling mantle plumes – hotspots Hawaii, Iceland solidus liquidus geotherm
Magma: mixture of molten rock, gases and mineral phases, produced by mantle melting Mantle melts between ~800-1250ºC due to: • Increase in temperature • Decrease in pressure • Addition of volatile phases Partial melting Adiabatic rise of mantle material with no heat loss – decompression melting Mid-Ocean Ridges
Magma: mixture of molten rock, gases and mineral phases, produced by mantle melting Mantle melts between ~800-1250ºC due to: • Increase in temperature • Decrease in pressure • Addition of volatile phases (e.g., water) 0 Mantle solidus is depressed by addition of water Subduction zone settings Wet mantle plumes 50 100 Depth (km) 150 200
Mantle melting: endmember models Batch melting: Melt remains in contact with residual crystals at all times, so the bulk composition remains constant Fractional melting: Melt leaves the system as soon as it is formed, so the bulk composition of the residual solid changes continuously. • Incompatible elements: preferentially partition into the melt phase (D<1) • Compatible elements: preferentially partition into the solid phase (D>1) • Partition or distribution coefficient (D) = Csolid/Cliquid Spider diagram showing depleted MORB vs. enriched OIB sources Concentrations normalized to bulk earth, C1 chondrites, or primitive mantle Most incompatible Less incompatible
Relating trace element concentrations to melt fraction (F) Batch melting equation: Cliq/Csol = 1/(F+D(1-F)) Fractional melting equation: Cliq/Csol = (1/D)*(1-F)(1/D-1) E. Klein, “The Crust”, T.I.G series
Spider diagram of crust vs mantle Workman and Hart, 2005
Rare Earth Element diagrams • REE are a group of 15 elements with atomic numbers ranging from 57 (La) to 71 (Lu) – LREE vs. HREE • Although they are geochemically similar, they have different partition coefficients so are sensitive tracers of source enrichment, the degree of melting and/or fractional crystallization Shaw et al., 2009
Oman ophiolite Samples of the mantle 1) Ophiolites • Slabs of oceanic crust and upper mantle • Thrust at subduction zones onto edge of continent 2) Dredge samples from oceanic fracture zones 3) Nodules and xenoliths in basalts 4) Kimberlites • Diamond-bearing pipes blasted up from the mantle carrying xenoliths from depth Hacker
Felsic or SiAlic Rocks – Silicon, Aluminum rich, usually light coloured