Download
1 / 12
120 likes | 284 Vues
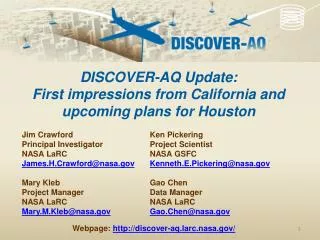
DISCOVER-AQ Update: First impressions from California and upcoming plans for Houston. Jim Crawford Principal Investigator NASA LaRC James.H.Crawford@nasa.gov Mary Kleb Project Manager NASA LaRC Mary.M.Kleb@nasa.gov. Ken Pickering Project Scientist NASA GSFC

E N D
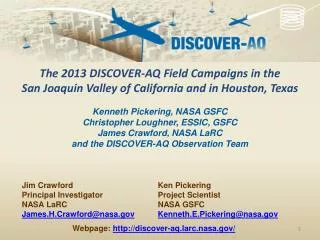
DISCOVER-AQ Update: First impressions from California and upcoming plans for Houston Jim Crawford Principal Investigator NASA LaRC James.H.Crawford@nasa.gov Mary Kleb Project Manager NASA LaRC Mary.M.Kleb@nasa.gov Ken Pickering Project Scientist NASA GSFC Kenneth.E.Pickering@nasa.gov Gao Chen Data Manager NASA LaRC Gao.Chen@nasa.gov Webpage: http://discover-aq.larc.nasa.gov/
Investigation Overview Deriving Information on Surface Conditions from Column and VERtically Resolved Observations Relevant to Air Quality A NASA Earth Venture campaign intended to improve the interpretation of current and future satellite observations to diagnose near-surface conditions relating to air quality Objectives: 1. Relate column observations to surface conditions for aerosols and key trace gases O3, NO2, and CH2O 2. Characterize differences in diurnal variation of surface and column observations for key trace gases and aerosols 3. Examine horizontal scales of variability affecting satellites and model calculations NASA King Air NASA P-3B Deployments and key collaborators Maryland, July 2011 (EPA, MDE, UMd, UMBC, Howard U.) California, January 2013 (EPA, CARB, UC-Davis&Irvine) Texas, September 2013 (EPA, TCEQ, U. of Houston) Colorado, Summer 2014 (EPA, NSF, NOAA, CDPHE) NATIVE, EPA AQS, and associated Ground sites
Deployment Strategy Systematic and concurrent observation of column-integrated, surface, and vertically-resolved distributions of aerosols and trace gases relevant to air quality as they evolve throughout the day. Three major observational components: NASA King Air (Remote sensing) Continuous mapping of aerosols with HSRL and trace gas columns with ACAM NASA P-3B (in situ meas.) In situ profiling of aerosols and trace gases over surface measurement sites Ground sites In situ trace gases and aerosols Remote sensing of trace gas and aerosol columns Ozonesondes Aerosol lidar observations
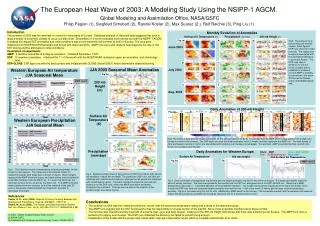
DISCOVER-AQ California HSRL-2 on the King Air Maps the Spatial Distribution of Aerosol between ground monitors across the valley Ten science flights documented the details of two successive PM2.5 episodes in the San Joaquin Valley Fresno Fresno Bakersfield Bakersfield PM2.5 (16 January - 7 February) Aerosol Scattering from the P-3B shows the build up of fine particles to be concentrated in a shallow layer below 2000 feet. 16 Jan 22 Jan Bakersfield *Orange line (36 ug/m3) is the 24hr average threshold for violating National Ambient Air Quality Standards (Photo taken from ER-2 during PODEX flight on 20 January) 550 nm Scattering (Mm-1)
PM2.5 and AOD at Bakersfield during a build-up (16-24 Jan 2013) PM2.5 (ug/m3) AOD (500 nm; level 1.5 data)
P-3B profiles of BL structure over Porterville on 20 Jan 2013
How shallow is the boundary layer? (Bakersfield, 21 Jan 2013)
HSRL-2 Aerosol Microphysical Retrievals Changes in Aerosol Properties between Feb. 1 and Feb. 4 • Increase in effective radius • Increase in scattering and absorption Feb. 1 Afternoon Flight Feb. 4 Afternoon Flight Eff. Radius: 0.2 - 0.25 µm Eff. Radius: 0.15 - 0.20 µm Scat. Coeff (532nm): > 350 1/Mm Scat. Coeff (532nm): 250 – 300 1/Mm Abs. Coeff (532nm): 20 – 30 1/Mm Abs. Coeff (532nm): > 30 1/Mm
Software: • automated, unsupervised, fast • data products are delivered the day after a research flight Microphysical Properties From Inversion of Backscatter (355,532,1064nm) + Extinction (355,532nm) • Microphysical Properties: • effective radius, number, surface-area, and volume concentration • fine and coarse mode • complex refractive index • Optical Data Products (just a few examples): • scattering and absorption coefficients, single-scattering albedo • 355, 532, 1064nm • effective variance, phase function and asymmetry parameter in 2013 • Specific Features: • vertically resolved profiles • data products reflect ambient atmospheric conditions
Data Availability Baltimore-Washington: Currently Available California: Available on 15 June 2013 Texas: Available on 1 February 2014
Houston Plans (September 2014) P-3B (red line; in situ trace measurements) King Air (blue line; remote sensing) 15 Aeronetsunphotometers 14 Pandora spectrometers 2 ozone lidars 2 aerosol lidars 2 Ozonesonde sites 4 Radar profilers Extensive ground-based sampling from multiple teams GEO-Cape ship in the Gulf of Mexico GeoTASO demonstration