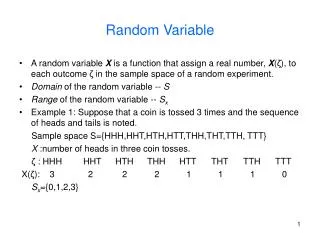
Simulation of high variable random processes through the spectral- representation-based approach
270 likes | 360 Vues
Explore the simulation of random processes through the spectral representation method. Enhance variability with the Butterworth filter. Obtain numerical results and draw conclusions for both stationary and non-stationary cases.

Simulation of high variable random processes through the spectral- representation-based approach
E N D
Presentation Transcript
Simulation of high variable random processes through the spectral- representation-based approach Pierfrancesco Cacciola Senior Lecturer in Civil Engineering ( Structural Design ) School of Environment and Technology, University of Brighton, Cockcroft building, Lewes Road, BN2 4GJ, Brighton, UK
Outline Simulation of random processes via the spectral representation method Enhancing the variability of the spectral representation method Butterworth filter Numerical results Concluding Remarks
Simulation of random processes via the spectral representation method • Consider the zero mean one-dimensional and uni-variate Gaussian non-stationary stochastic process defined as • Evolutionary power spectral density function defined (Priestley, 1965) • Where with is a small interval
Simulation of random processes via the spectral representation method • the ensemble average in equation is not commonly used to define the evolutionary spectrum due the difficulties in its numerical evaluation related to the Uncertainty Principle. Therefore indirect representation • As a consequence
Simulation of random processes via the spectral representation method • Stationary case: Wiener-Khintchin relationships
Simulation of random processes via the spectral representation method • For the stationary case the power spectral density function can be also determined directly from experimental data • Once defined the power spectral density function either through experimental or physical/theoretical approaches the simulation of the sample of the non-stationary random process through the spectral representation method is performed using the following equation (Shinozuka and Deodatis 1988, Deodatis 1996)
Simulation of random processes via the spectral representation method • The simulated process is asymptotically Gaussian as N tend to infinity due to the Central Limit Theorem • The ensemble averaged mean and correlations tends to the target • BUT • The variability of the energy distribution/Fourier spectra is not controlled
Enhancing the variability of the spectral representation method: Recorded Earthquakes in Messina 4 0 -4 4 0 -4 8 4 0 -4 -8 0 10 20 30 ] c 2 e s / m c [ g a 0 10 20 30 t i m e [ s e c ] ] c 2 e s / m c [ g a 0 5 10 15 20 t i m e [ s e c ] ] c 2 e s / m c [ g a t i m e [ s e c ] 10 ] 0 c 2 e s / m c [ g a -10 0 10 20 30 40 t i m e [ s e c ]
Enhancing the variability of the spectral representation method: Recorded Earthquakes in Messina
Enhancing the variability of the spectral representation method: Recorded Earthquakes in Messina
Enhancing the variability of the spectral representation method: Recorded Earthquakes in Messina
Enhancing the variability of the spectral representation method • To enhance the variability of the simulated random samples in this paper it is proposed to introduce a random filter acting in series with the expected value of the power spectrum is the vector collecting the random parameters of the filter is real positive function that satisfies the following equation is the joint probability density function of random parameter of the filter
Enhancing the variability of the spectral representation method • Embedding the proposed random spectrum in the traditional spectral representation method (SRM) the following simulation formula is derived The samples generated by equation are Gaussian as N tends to infinity due to the Central Limit Theorem and converge to the target mean and correlation function (proved in the paper)
Butterworth filter can be determined considering the distribution of the energy around the expected vale for each frequency (practically unfeasible). Alternative strategy is to consider synthetic parameters defining the variability of the energy distribution such as the bandwidths and central frequency. To this aim the following pass-band Butterworth filter will be adopted
Butterworth filter • The distribution of the filter parameters and can be defined through experimental data measuring the central frequency and bandwidth of the squared Fourier spectrum of the recorded samples.
Butterworth filter • to illustrative purpose the filter parameters will be assumed statistical independent and uniformly distributed. Therefore, Therefore, with
Numerical results • Stationary case: Kanai-Tajimi spectrum - simulated samples : a) Traditional SRM; b) proposed EV-SRM
Numerical results • Stationary case: Kanai-Tajimi spectrum – Fourier transform of the simulated samples :a) Traditional SRM; b) proposed EV-SRM
Numerical results • Stationary case: Kanai-Tajimi spectrum – proof of convergence
Numerical results • Non-Stationary case: Evolutionary Kanai-Tajimi spectrum - simulated samples : a) Traditional SRM; b) proposed EV-SRM
Numerical results • Stationary case: Evolutionary Kanai-Tajimi spectrum – Fourier transform of the simulated samples :a) Traditional SRM; b) proposed EV-SRM
Numerical results • Stationary case: Evolutionary Kanai-Tajimi spectrum – proof of convergence
Numerical results • The influence of the enhanced spectrum variability is then investigated through the Monte Carlo study of the distribution of peak values • Convergence of the mean value of the peak versus the number of samples n for the a) stationary and b) non-stationary process: traditional SRM (solid line), SRM with enhanced variability (dash-dotted line).
Numerical results • The influence of the enhanced spectrum variability is then investigated through the Monte Carlo study of the distribution of peak values • Convergence of the variance of the peak value versus the number of samples n for the a) stationary and b) non-stationary process: traditional SRM (solid line), SRM with enhanced variability (dash-dotted line).
Numerical results • The influence of the enhanced spectrum variability is then investigated through the Monte Carlo study of the distribution of peak values • Comparison between the distribution of peaks for the a) stationary and b) non-stationary process: traditional SRM (solid line), SRM with enhanced variability (dash-dotted line).
Numerical results • The influence of the enhanced spectrum variability is then investigated through the Monte Carlo study of the distribution of peak values • Comparison between the cumulative distribution of peaks for the a) stationary and b) non-stationary process: traditional SRM (solid line), SRM with enhanced variability (dash-dotted line).
Concluding remarks • A modification to the traditional spectral-representation-method aimed to control the variability of the simulated samples of the random process is proposed. • The Butterworth pass-band filter with random parameters has been included in the simulation formula to generate samples with different Fourier spectra. • Remarkably the peak distribution is significantly sensible to the spectrum variability and the latter should be carefully considered when reliability analyses are performed. • It is also expected in general that the spectrum variability influence whereas non-linear transformation of the power spectrum.are involved.