Download
1 / 2
20 likes | 125 Vues
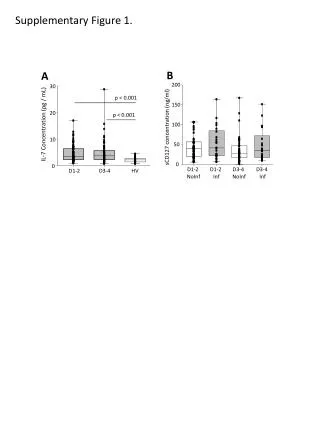
This study presents two supplementary figures that investigate the relationship between IL-7 concentration and sCD127 levels with patient survival. Figure 1 illustrates the IL-7 concentrations measured in pg/mL and sCD127 concentrations in ng/mL across different patient groups. Figure 2 provides survival curves based on sCD127 levels at two distinct time points (D1 and D3) in correlation with SAPS II scores. The data suggest a significant association between these biomarkers and patient outcomes, highlighting their potential in prognostic assessments.

E N D
Supplementary Figure 1. A 30 p < 0.001 p < 0.001 20 IL-7 Concentration (pg / mL) 10 0 D1-2 D3-4 HV B 200 150 100 sCD127 concentration (ng/ml) 50 0 D1-2 NoInf D1-2 Inf D3-4 NoInf D3-4 Inf
Supplementary Figure 2. A. Survival curves based on sCD127 (D1) and SAPSII sCD127 ≤ 48.78 - SAPSII ≤ 59 sCD127 ≤ 48.78 - SAPSII > 59 sCD127 > 48.78 - SAPSII ≤ 59 sCD127 > 48.78 - SAPSII > 59 B. Survival curves based on sCD127 (D3) and SAPSII sCD127 ≤ 41.56 - SAPSII ≤ 59 sCD127 ≤ 41.56 - SAPSII > 59 sCD127 > 41.56 - SAPSII ≤ 59 100 100 80 80 sCD127 > 41.56 - SAPSII > 59 60 60 Percent survival Percent survival 40 40 20 20 0 0 0 10 20 30 0 10 20 30 Days Days


