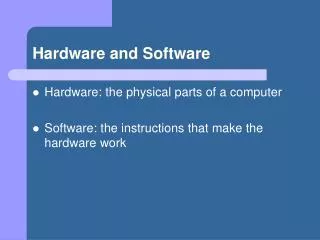
Hardware and Software
The SCV Visualization Workshop held in Fall 2008 provided in-depth insights into the visualization pipeline, focusing on hardware and software tools utilized in scientific visualization. Attendees learned about various components from field instruments and supercomputers to graphics machines. The workshop covered essential data acquisition, preparation, rendering, and post-processing techniques, featuring tools such as Matlab, IDL, VTK, OpenGL, and Maya. It showcased diverse workflows and demonstrated how sophisticated visualizations can be created from complex scientific data, fostering better understanding through visualization.

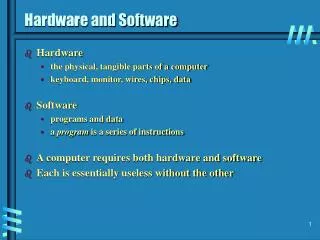
Hardware and Software
E N D
Presentation Transcript
Hardware and Software Erik Brisson ebrisson@bu.edu SCV Visualization Workshop – Fall 2008
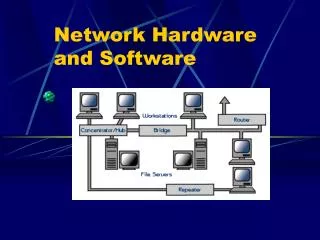
The Visualizion Pipeline - Hardware Field instruments Scientists/programmers Supercomputers Graphics machines Publications, movies/DVDs, web Demos, educational software SCV Visualization Workshop – Fall 2008
The Visualization Pipeline - Software SCV Visualization Workshop – Fall 2008 Data acquisition and preparation Sci vis tools Geometric representation Rendering Post-processing
Data analysis tools SCV Visualization Workshop – Fall 2008 • Matlab and IDL • Powerful mathematics libraries • Basic sci vis tools • Simple rendering
Scientific visualization tools SCV Visualization Workshop – Fall 2008 • VTK, Paraview • Limited mathematics processing • Specialized sci vis tools • Built for speed / interactivity • Decent rendering
Graphics / Display SCV Visualization Workshop – Fall 2008 • OpenGL, OpenSceneGraph, SGI Performer • Packages for programming graphics • Flexibility and control
Rendering, modeling, animation SCV Visualization Workshop – Fall 2008 • Maya • Sophisticated user interface • Powerful modeling tools • Beautiful rendering
2D graphics and movies SCV Visualization Workshop – Fall 2008 Adobe Photoshop (and Gimp) Adobe Premiere
Plotting SCV Visualization Workshop – Fall 2008 Matlab, IDL Gnuplot, Xmgrace Excel
Virtual Environments SCV Visualization Workshop – Fall 2008 DAFFIE
General data wrangling SCV Visualization Workshop – Fall 2008 C / C++, Fortran, Perl, Java, etc
Example workflow – molecular dynamics • Simulation creates data files • Molecule x,y,z + type • colored spheres (C program) • Electron density as volume data • isosurfaces (IDL) .obj files • Rendered in Maya SCV Visualization Workshop – Fall 2008
Example workflow –pressure on turbine • Simulation run on supercomputer • Produced many Plot3d files • C code transforms data to .obj files • Rendered in Maya • Processed using Imagemagick for DVD Wall movies SCV Visualization Workshop – Fall 2008
Example workflow –showing entropy • Isosurfaces in IDL • Convert output into .obj • Render in Maya, with transparency • View in 3D on Wall SCV Visualization Workshop – Fall 2008
Example workflow –stretched water • Given positions of atoms in water • How to show “holes”? • Construct volume data of distance • Use volume visualization SCV Visualization Workshop – Fall 2008
Example workflow –CISM • Researchers used OpenDX • SCV staff modified OpenDX networks • Produced wall movies and demos SCV Visualization Workshop – Fall 2008
Many posiible workflows SCV Visualization Workshop – Fall 2008 Data Matlab VTK OpenGL Maya IDL Paraview OSG Photoshop Gnuplot DAFFIE Performer Premier Xmgrace Excel
The End SCV Visualization Workshop – Fall 2008