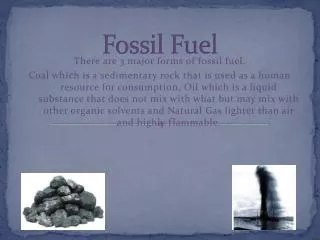
Fossil Fuel Resources
Fossil Fuel Resources. Dennis Silverman Physics and Astronomy U C Irvine. I. Future of Fossil Fuels. Petroleum Natural Gas Coal Oil Shale and Tar Sands CO 2 Emissions. Fossil Fuel Energy Units. The Quad is 10 15 Btu (British Thermal Units)

Fossil Fuel Resources
E N D
Presentation Transcript
Fossil Fuel Resources Dennis Silverman Physics and Astronomy U C Irvine
I. Future of Fossil Fuels • Petroleum • Natural Gas • Coal • Oil Shale and Tar Sands • CO2 Emissions
Fossil Fuel Energy Units • The Quad is 1015 Btu (British Thermal Units) • Total U.S. energy use is nearly 100 Quad per year. • A barrel of oil (bbl) is 5.8 million Btu. • So 100 Quads is equivalent to 100 x 1015 / 5.8 x 106 = 17 x 109 bbl or 17 billion barrels of oil. • A barrel of oil is 42 gallons.
U.S. 20 Year Projections of Energy Use in Quadrillions of BTUs (Quads)
Petroleum Fuel Future • The fossil fuel supply is expected to follow a bell shaped curve as developed by M. King Hubbert. The peak in the curve of yearly supply is the important point. • US oil production peaked around 1970. • World population growth is expected at 1% a year. • US energy consumption is increasing at 1.5% a year. • The US imports 60% of its oil. • Proven world oil reserves are about 2,000 billion barrels. • Unproven reserves may boost this to 3,000-4,000 billion barrels. • For world oil demand growing in the range between 0-2 percent a year, the year of the projected peak is shown in the next slide. • (A lifetime here is 75 years.) • The mean assessment of the reserves of the Artic National Wildlife Refuge (ANWR) is 6 billion barrels (if the price is greater than $25/barrel).
Optimistic 3,000 Bbl of oil total resources. US Geological Service
Superoptimistic Oil Plus Oil Shale 3,800 Billion Barrels Oil To Burn
US and World Natural Gas • US demand growth is 3% per year. • A shortage now exists in the US and plans for Liquid Natural Gas (LNG) terminals for imports exist around the country (Ventura, Long Beach, Baja California) • LNG could grow from 1% now to 20% by 2020. • The graphs are for the time the supply will last. • The units are in Quads (Quadrillion BTUs) • The whole US energy consumption in all forms is 100 Quads per year.
Total reserves, with natural gas reserves in equivalent billion barrels of Oil (bbl). World oil consumption is 30 bbl/year. Left out Canadian tar sands at 179 bbl oil. US has 22 bbl oil, and produces 2.0 bbl/year and would last only 11 years. World Oil and Natural Gas Reserves
US Coal Supply • The total US coal reserve is 5700 Quads. • The current rate of use is about 20 Quads per year. • Population growth will reduce its longevity from 250 years with no growth • Conversion to motor fuel uses 2 Quads of coal to generate 1 Quad of fuel plus the additional CO2 emission. • Conversion to hydrogen fuel uses even more. • The following graph of US coal lifetime assumes 54% of underground coal is recoverable. • Estimates are for various growth rates of use.
Dilute Fossil Residues • Oil shale or tar sands has dilute amounts of heavy oil or near-solid carbonaceous residues. • Surface is mined at 2 tons per barrel of oil. • Deeper deposits are steam diluted and further processed to yield fuel, using energy, and costing CO2 production. • Cost is range of $20-$40/barrel before shipping. • It also contains nitrogen and heavy metal compounds. • The US has little. Worldwide estimates are large but speculative. 180 billion barrels worth in Canada. • Source for several of the previous graphs is on the web in Physics Today, July 2004, by Paul B. Weisz.
Methane (Gas) Hydrates Possibilites • Methane, CH4, surrounded by water molecules in an ice form is methane hydrate. They are stable in a range of continental shelves at low density. • The total amount is in the range of 500-2500 gigatons (billion tons) of carbon, to be compared to 5000 gigatons carbon for all fossil fuel reserves. • Dangers: GW and increased sea levels could flood the Arctic and melt the permafrost, releasing 400 gigatons of methane as a Greenhouse gas. Total atmospheric carbon is 700 gigatons. • Some past rapid warming may have occurred from methane release. New UCI paper says there may be too little. • Methane accounts for ½ the warming of CO2 at only 1.7 ppm. • William Reeburgh at UCI investigating these gases.
Fossil Fuel Future Summary • Oil, Natural Gas, Shale Oil, and Coal produce CO2. • Carbon sequestration requires an extra 30% of power and needs research. FutureGen $1 billion research plant. • Oil is needed for transportation fuel • Too expensive for electricity generation • Reserves: About 50 years with growth in use • 2/3 is in the Middle East • Coal may be converted to liquid fuel for transportation • 250 years at current rate, 100 years with conversion • Total world reserve of oil is a large question, uses politically motivated estimates of individual countries • Current rate of use of fossil fuels will increase world wide • U S proposed climate technology program
Short Term Optimum • The best way to hold down CO2 increases is to remove fossil fuels from electricity generation, but use it just for vehicles. • Since ½ of US electricity comes from coal which generates twice as much CO2 per energy unit as does natural gas, we should switch to natural gas. This, however, involves massive and possibly costly imports. • We need increases in alternate energy sources such as hydro, nuclear, wind and solar. • We also need increases in energy efficiency and conservation. • This especially includes high mileage vehicles.
What can California Do? • California is the world’s fifth largest economy, and has led the way on reducing vehicle pollution before. • State law for utilities to increase renewable electricity to 20% by 2017. Can increase and extend to city power. • Use combined heat and electricity systems in large plants. • Clean up older, high polluting plants. • Mass transit and growth planning. • Removing firewood in forests and increasing them as a carbon storage component. • See Union of Concerned Scientists: www.climatechange.org • Unfortunately, they leave out a nuclear plant option.
Cost of Gasoline and Taxes • Elsewhere in the world the cost of gas is around $1/liter, or $4/gallon. • Gas taxes per gallon in various countries: • Great Britain $3.40 • Italy $2.53 • Germany $2.56 • Japan $2.04 • US Federal Excise Tax per gallon is $0.18 • California Excise Tax is $0.18 • Wisconsin is $0.31, Alaska is $0.08 • California State and Local Taxes are $0.14 • Total tax in California is $0.50/gallon
Signs of Progress • Nationally: US reducing off-road vehicle diesel emission 90% by 2010. • California: Committing to lower greenhouse emission fuel in new autos by 30% by 2016. • Seven northeastern states likely to follow this (NY, NJ). • Canada demanding 25% reduction in new cars by end of this decade. • CA estimates cost of $1,000 per vehicle with continuously variable transmission, alternative AC coolant, and engines that shut off cylinders. • A 20% reduction in GW gasses with existing technology would pay off in fuel cost savings in three years of driving. • Zero Emission Vehicle regulation will generate 200,000 hybrids per year by 2015.
Fossil fuel near-term caveats • We have also seen decreases in proven reserves. Some examples: • Shell reduced its estimates by 15% in a desire to conform to corporate honesty. • The US DOE continues to project Saudi future output at 15 million barrels a day, despite the Saudi’s claim that they won’t grow much beyond the new 12.5 million barrels a day. • Estimates were that Iraq has ruined its oil fields and that its reserves, once thought to be greater than the Saudi’s, will only come in at 15% of previous estimates. • DOE claims Iraq reserves at 200-300 bbl, USGS claims only 78 bbl known and only 45 bbl undiscovered. • The Russians seem to be finding that using water to pump more oil out of fields only seems to ruin them, and their fields will not be as productive as previously estimated.