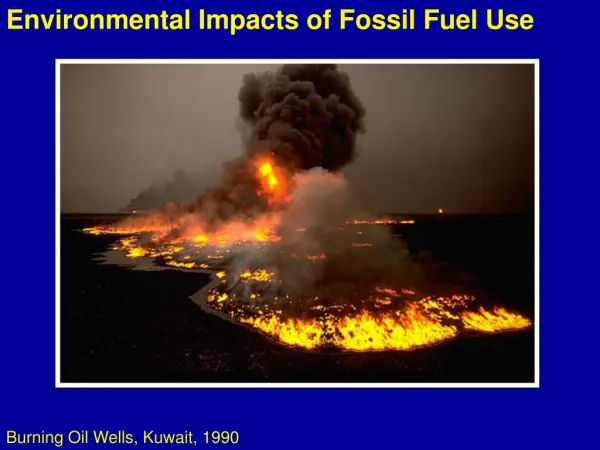
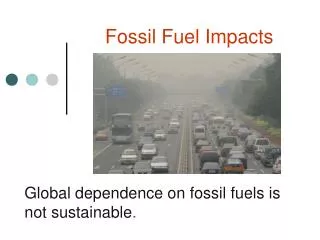
Fossil Fuel Use, Resources and Global Warming
Fossil Fuel Use, Resources and Global Warming Dennis Silverman Physics and Astronomy U C Irvine www.physics.uci.edu/~silverma/resources.ppt October 7, 2005 Our Energy Future Future of Fossil Fuels Use and Resources Global Warming I. Future of Fossil Fuels Petroleum Natural Gas Coal

Fossil Fuel Use, Resources and Global Warming
E N D
Presentation Transcript
Fossil Fuel Use, Resources and Global Warming Dennis Silverman Physics and Astronomy U C Irvine www.physics.uci.edu/~silverma/resources.ppt October 7, 2005
Our Energy Future • Future of Fossil Fuels Use and Resources • Global Warming
I. Future of Fossil Fuels • Petroleum • Natural Gas • Coal • Oil Shale and Tar Sands • CO2 Emissions
U.S. 20 Year Projections of Energy Use in Quads (U.S. Uses 100 Quads/year)
Petroleum Fuel Future • US oil production peaked around 1970. • US energy consumption is increasing at 1.5% a year. • The US currently imports 60% of its oil. • Proven total world oil resources was about 2,000 billion • About 800 billion of this has already been used. • More discovery and increasing recovery to 50% from 30% may boost this to 3,000 billion barrels total. • At the peak the price rises steeply and consumption must level off, perhaps leading to recession. • However, we may see a very flat, long peak where prices rise, bringing in new oil resources to keep production flat, with efficiency and conservation setting in to hold demand flat to a fixed supply. • It is unlikely that major investment in refineries and tankers would be made only a decade before a sharp decline, again leading to a plateau. The year of a “peak” is then irrelevant, but the production level is important.
World Oil Growth and Decline - Pessimistic 2,000 Bbl resources (1,000 Bbl reserve)
Optimistic 3,000 Bbls of oil total resources. US Geological Survey
U. S. Oil Sources(U.S. 35%, 65% imported, including 33% from OPEC). Map shows percent of imports.
US and World Natural Gas • US demand growth is 3% per year. • A shortage now exists in the US and plans for Liquid Natural Gas (LNG) terminals for imports exist around the country (Ventura, Long Beach, Baja California, and up to 40 sites nationwide). • The Federal Government wants the final say on allowing siting of these terminals. • LNG could grow from 1% now to 20% by 2020. • The graphs are for the time the supply will last. • The lighter color is less likely than the darker part.
Total reserves, with natural gas reserves in equivalent billion barrels of oil (bbl). World oil consumption is 30 bbl/year. Left out Canadian tar sands at 179 bbl oil. US has 22 bbl oil, and produces 2.0 bbl/year and would last only 11 years. World Oil and Natural Gas Reserves
US Coal Supply • The total US coal reserve is 5700 Quads. • The current rate of use is about 20 Quads per year. • Population growth will reduce its longevity of 250 years with no growth • Conversion to motor fuel uses 2 Quads of coal to generate 1 Quad of fuel plus the additional CO2 emission. • Conversion to hydrogen fuel uses even more. • The graph assumes 54% of underground coal is recoverable. • Estimates are for various growth rates of use.
Fossil Fuel Future Summary • Oil, Natural Gas, Shale Oil, and Coal produce CO2. • Carbon sequestration requires an extra 30% of power and needs research. FutureGen $1 billion research plant. • Oil is needed for transportation fuel • Too expensive for electricity generation • Total world reserve of oil is a large question, uses politically motivated estimates of individual countries and industry secrets • Reserves: About 50 years with growth in use • 2/3 is in the Middle East • Coal may last 100 years with growth in usage, but only 70 years if partly converted to replace oil • Current rate of use of fossil fuels will increase worldwide • U S proposed climate technology program
Short Term Optimum • The best way to hold down CO2 increases is to remove fossil fuels from electricity generation, but just use gasoline for transportation and natural gas for heating. • Since ½ of US electricity comes from coal which generates twice as much CO2 per energy unit as does natural gas, we should switch to natural gas. This, however, involves massive imports. • We need increases in alternate energy sources such as hydro, nuclear, wind and solar. • However, coal and LNG will be cheaper than nuclear, so a sacrifice is required here. • Solar cells are very expensive. Direct solar water heating is much more efficient. • We also need increases in energy efficiency and conservation. • This especially includes high mileage vehicles.
II Global Warming Effects • Predicted Global Warming of 5°F will affect everyone in most structural aspects of society and in their costs. • We don’t realize how our present housing, business, and supply nets are closely adapted to our current climates. • The major increase in temperature and climate effects such as rainfall, drought, floods, storms, and water supply, will affect household and business insulation, heating and cooling energy, and farming. These may require large and costly modifications. • Some present cold areas may benefit, and some hot areas will become unfarmable and costly to inhabit. • It is very misleading to portray the problem as a purely environmentalist issue which affects only polar bears, a few Pacific islanders, and butterflies.
Global Temperature Record:Unusual 1° F Rise in the Last Century
700 The last 160,000 years (from ice cores) and the next 100 years:temperature (red) tracks CO2 (green). CO2 in 2100 (with business as usual) 600 Double pre-industrial CO2 Time (thousands of years) 500 Lowest possible CO2 stabilisation level by 2100 400 CO2 concentration (ppm) CO2 now 300 10 Temperature difference from now °C 200 0 –10 100 160 120 80 40 Now
CO2 Production Rate • Pre-industrial 275 ppm CO2 will be doubled to 550 ppm by adding 200 ppm to the present 350 ppm. • Present burning of 360 Quads of fossil fuel per year can increase CO2 by 3.4 ppm per year. • Thus 200 ppm will be added by 60 years, or sooner if fuel use increases. • Climate models have a mean prediction of an increased temperature of 5° F for this doubling of CO2.
Comparison of CO2 Doubling to Fossil Fuel Reserves • 360 Quads over 60 years is 22,000 Quads, which would double pre-industrial CO2 • Tripling CO2 will require another 30,000 Quads • Summary of estimated fossil fuels: • 23,000 Quads world coal • 10,000 Quads natural gas • 6,000 – 12,000 Quads oil • (6,000+ possible tar sands, oil shale, depending on cost) • Total 40,000 – 50,000 Quads of fossil fuel available. • Ignoring Carbon absorption, burning all fossil fuel can lead to tripling pre-industrial CO2. • To stop at doubled CO2, we must use no more than half of available fossil fuels.
Allocating Carbon Use Fees • Just as we have a gas tax to pay for roads, carbon taxes should be applied to pay for the total cost of fossil fuels. • This is one main way to limit carbon production below the consumption of all fossil fuels. • The costs include that of securing energy sources, or energy wars, that may get more severe as the value and competition for energy increases. So far, the Iraq war has been allocated $200 billion. There was also the 90s retaking of Kuwait. • The costs should also include U.S. and foreign damages from global warming. • Whereas the New Orleans and Gulf Coast flooding may not be due to global warming this time, there may be similar damages in the future from global warming. • There is also the moving of the Inuit villages from sea level rise. • And we expect future environmental and crop damage and relocations. • We pay for the energy security costs and massive damages anyway. By using carbon fees, we discourage wasteful uses of fossil fuel and encourage conservation, while calling attention to the full cost of these fuels compared to renewable resources which must replace them.
Comparative World CO2 EmissionsThe US emits 25% of World CO2
Global Warming Scenario • Greenhouse gases: CO2 , methane, and nitrous oxide • Already heat world to average 60° F, rather than 0° F without an atmosphere • The present radiation imbalance will cause another 1° F heating by 2050, even without more greenhouse gas emissions. • Recent cleaning of air is causing the earth’s surface to be hotter and brighter. • Stabilizing the amount of CO2 would require a reduction to only 5% to 10% of present fossil fuel emissions
Effects of the Doubling of CO2 • Doubling of CO2projected by end of century, causing ~ approximately a 5° F increase in average temperature (most rapid change in over 10,000 years) • ~2-3 foot sea level rise • More storms and fiercer ones as illustrated by Atlantic hurricanes this past year with 5° F hotter Caribbean sea temperatures • Loss of coral reefs • Increase in tropical diseases since no winter coolness to kill insects • 25% decline in species that cannot shift living ranges • Possible removal of Gulf Stream, causing ice age in Northern Europe • Warming expected to be greater over land • Hot areas expect greater evaporation from hotter winds, thereby causing drought • Lower heating costs in winter, more air conditioning costs in summer
Global Warming Effects • Global Warming is an average measure • Local warming or climate fluctuations can be very significant • Arctic is 5° warmer • Ice cap is ½ the thickness of 30 years ago • Antarctic is 5° warmer • Ice shelves over the sea are melting and breaking off and may allow the 10,000 foot thick ice sheet over Antarctica to slide off the continent faster • This would cause a sea level rise • An analogous local effect is that while ozone is affected everywhere, there is a more severe seasonal ozone hole over Antarctica • Rainfall is hard to predict. It could be increased or decreased. • Drought can partly be caused by increased evaporation at the higher temperature.
Global Warming effects in California • Summer temperatures rise by 4-8° F by 2100 for low emission scenario: 8-15° F for higher emissions. • Heat waves will be more common, more intense, and last longer. • Spring snow packs in the Sierra could decline by 70-90%, as winters will be warmer. • Agriculture, including wine and dairy, could be affected by water shortages and higher temperatures. • More forest fires. • Tree rings show that in eras of global warming, mega droughts of decades hit the southwest US.
Conclusions on Energy and GW • At current or increased rates of production, oil and natural gas will be gone in 50 years or so, and will be expensive long before that. • Production of oil from coal and tar sands could be somewhat expensive. • Use of coal for electricity would highly pollute smog prone areas. • With the high costs of fuel and of fuel conversion or substitution, the costs of global warming should be added in to promote alternate energy sources, including nuclear power. • Global warming will continue until we drop fossil fuel use to a small fraction of its present rate. • The costs of relocation, substitution, extreme weather, increased deaths, and diminishing fuel will soon exceed the costs of developing alternate energy sources. • The sooner we act in research and development, and conservation and conversion, the easier and less costly the transition will be.
Cost of Conversion to Industry (and Consumers) – Order of magnitude • At $60/barrel for oil, we are currently sending $220 billion per year to foreign oil sources. • The 1st gulf war required our presence to retake Kuwait and defend Saudi Arabia for their oil resources. • The 2nd gulf war (Iraq) may be costing us $100 billion per year at present, to some day make available more oil resources. • Even if nuclear reactors cost as much as $5 billion each, we could build 40 nuclear plants a year with this money. • Since nuclear is 20% of our electricity with 100 plants, in 10 years of such payments we could produce 400 more plants and have 100% of our electricity nuclear. • Use plants at night to charge up electric car batteries. • The economics is similar to the question of renting versus owning. • The costs of building and operating U.S. plants also go to American workers, not overseas. • So we are already spending the magnitude of funds necessary to convert, but not accomplishing it.
What can California Do? • California is the world’s fifth largest economy, and has led the way on reducing vehicle pollution before. • State law for utilities to increase renewable electricity to 20% by 2017. Can increase and extend to city power. • BEWARE: Million solar roof initiative will spend $23 billion to create the power of only half a nuclear reactor. • Use combined heat and electricity systems in large plants. • Clean up older, high polluting plants. • Mass transit and growth planning. • Removing firewood in forests and increasing them as a carbon storage component. • See Union of Concerned Scientists: www.climatechange.org • Lower greenhouse emissions from cars by 30% by 2017
The Invisibility of Modern Energy and Global Warming • In ancient times we gathered firewood and watched it burn. With steam powered transportation we saw the coal loaded and burned, and the steam go off. • Today, we pump gas invisibly, and burn it with no visible emission. • We don’t see the oil being pumped from the ground, although we can see tankers in the harbor and refineries. We don’t see it flowing through pipelines. • We don’t see the electricity powering our houses except through light, and don’t monitor its usage. We usually don’t see the power plants. We often don’t even see power lines to our houses. • In natural gas heating we don’t see the gas burn or the heater and we don’t monitor it. • The greenhouse gases are invisible to us so we can’t see their emission or buildup. • Their effects on temperature show up globally with careful averaging, and often in subtle effects. • Any particular warming area or period is hard to precisely attribute to global warming. • Eventually global warming effects will be more prevalent, after much of its prevention period is gone.
Signs of Progress • Globally: The Kyoto Treaty went into effect in Feb. 2005, with signers reducing emissions to 5% below 1990 levels, except for developing countries which includes China. China, however, with many smoggy cities, is planning 30 nuclear reactors by 2020, and considering 200-300 by 2050, including breeder and pebble bed reactors. • Nationally: Western governors committing to 20% renewable energy sources by 2020. • New mileage limits on SUVs and light trucks by 2011. • GM Gen IV V-8 with cylinder shutdown technology to 4 cylinders to give 6-20% better fuel economy. Honda will apply this to V-6 also including hybrids.
Renewable energy sources • Hydroelectric: very useful • At 30% – 50% of maximum use • Effects of dams • Variable with season and climate • Wind power: Need high wind areas (13 mph) on cheap land • 600-2000 large turbines the equivalent of a nuclear reactor • Would need 30 linear miles of turbines • Already scenic protests in Nantucket • Many areas far from the power grid • Can be as cheap as natural gas • If the wind dies down or is too high, have to have a full backup in fossil fuel plants to avoid outages • Waiting for Tax Credit law renewal • 30-40% average delivery of maximum rating, more in summer • San Gorgonio area averages about 1/10 of a nuclear reactor • California wind contribution is 1.27% from three areas
Solar Power • Solar power: 80% efficient for water heating on roofs • Only 10% efficient for rooftop electricity • Solar cell electricity more costly by a factor of 10 • 40 square miles equivalent to one nuclear reactor • The sun doesn’t shine at night • If cloudy, need full backup with fossil fuel plants to avoid power outages • Need more research to improve efficiency and to lower manufacturing costs
Biomass, Ethanol, and Geothermal • Biomass: Competes with farm use for food • Insufficient for total power by a factor of 40 • 2,000 square miles equivalent of one nuclear reactor • Burns to methane and nitrous oxide, both greenhouse gases • Sea growing possibilities being researched • Ethanol: Political Issue for Rural (Red) States and areas • May be forced to include in gasoline as antiknock preventer, but no pipelines or ships, so truck transportation costly, and not needed by the Blue States or cities. Again, generates CO2. • Geothermal: Few sites, mostly in the west • Produces Sulfur and heavy element pollution • Drilled holes cool after sufficient water is heated
Conservation • Populations of largest CO2 producing countries are stabilizing • Mass transit, car pooling, cash for not parking • Transit Villages built around transportation lines • Fuel economy improvements • Hybrid and electric cars, cylinder shut down engines • Transportation replaced by communications • Energy smart offices, houses and buildings • Energy cost increases will drive conservation • CO2 production taxes and increased fuel taxes
Signs of Progress • Nationally: US reducing off-road vehicle diesel emission 90% by 2010. • Cities: Mayors of 130 cities have pledged to follow Kyoto formula, including Seattle and New York City. • California: Committing to lower greenhouse emission fuel in new autos by 30% by 2016. • Seven northeastern states likely to follow this (NY, NJ). • Canada demanding 25% reduction in new cars by end of this decade. • CA estimates cost of $1,000 per vehicle with continuously variable transmission, alternative AC coolant, and engines that shut off cylinders. • A 20% reduction in GW gasses with existing technology would pay off in fuel cost savings in three years of driving. • Zero Emission Vehicle regulation will generate 200,000 hybrids per year by 2015.
Scenarios of C production with different economies (gray) and with mitigation goals imposed (red)