Download
1 / 13
130 likes | 235 Vues
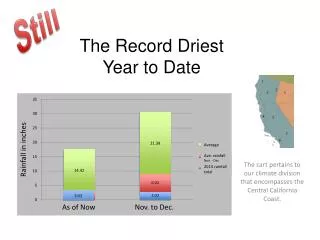
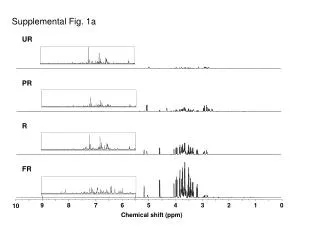
Fig 1a. Cumulative precipitation by date and site-year, with 25 year average . Fig 1. Cover crop emergence West Madison 2010. Bars are standard error of the mean. Fig 2. Cover Crop emergence at West Madison 2011 Bars are standard error of the mean.

E N D
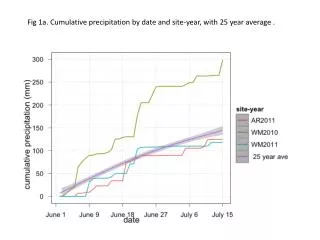
Fig 1a. Cumulative precipitation by date and site-year, with 25 year average .
Fig 1. Cover crop emergence West Madison 2010. Bars are standard error of the mean.
Fig 2. Cover Crop emergence at West Madison 2011 Bars are standard error of the mean.
Fig 3. Cover crop emergence Arlington 2011. Bars are standard error of the mean.
Fig 4. Cover crop and weed biomass at West Madison 2012 Bars are standard error of the mean.
Fig 5. Cover crop and weed biomass at West Madison 2011 Bars are standard error of the mean.
Fig 5. Cover crop and weed biomass at Arlington 2011 Bars are standard error of the mean.
Fig 8. Penetrometer resistance. Error bars are standard error of the mean.
Fig 10. Weed biomass in tilled plots at 3, 6, and 9 weeks – pooled sites
Fig 12. Weight of tilled cabbages by cover crop – pooled sites
Fig 13. Percent ground cover by species and planting date – pooled sites. Error bars are 95% CI.