GIS Analysis Functions
GIS Analysis Functions. INLS 110-111 GIS Digital Information: Uses, Resources & Software Tools. GIS Analysis Functions. Four broad categories Retrieval/classification/measurement Overlay (arithmetic, various conversions) Neighborhood Connectivity.

GIS Analysis Functions
E N D
Presentation Transcript
GIS Analysis Functions INLS 110-111 GIS Digital Information: Uses, Resources & Software Tools
GIS Analysis Functions • Four broad categories • Retrieval/classification/measurement • Overlay (arithmetic, various conversions) • Neighborhood • Connectivity
1. Retrieval, Classification, & Measurement Functions • Retrieval • Selective Search • Classification/Reclassification (Overlays, combine) • Identifying a set of features as belonging to a group • Defines patterns • Measurement • Distances, lengths, perimeters, areas
Retrieval: Selective Search addresses selected because they fall within circle
Reclassification (Vector) Dissolving to aggregate polygons
Reclassify by Area Size Work with areas > 80 acres
Reclassify by Contiguity Work with individual forest stands, rather than the class forest as a whole.
Reclassify values Work with elevations between 20 and 40 feet Change feet to meters
Vector Distance Operation: Buffers & Setbacks Diagram of simple buffers and a setback. NOTE: buffers go outward from lines or areas; setbacks run inside of areas (not lines). Image Source: Chrisman, Nicholas.(2002). 2nd Ed. Exploring Geographic Information Systems. p 154. fig. 6-1.
Buffer Creation: Illustrated Image Source: Chrisman, Nicholas.(2002). 2nd Ed. Exploring Geographic Information Systems. p 60. fig. 6-3.
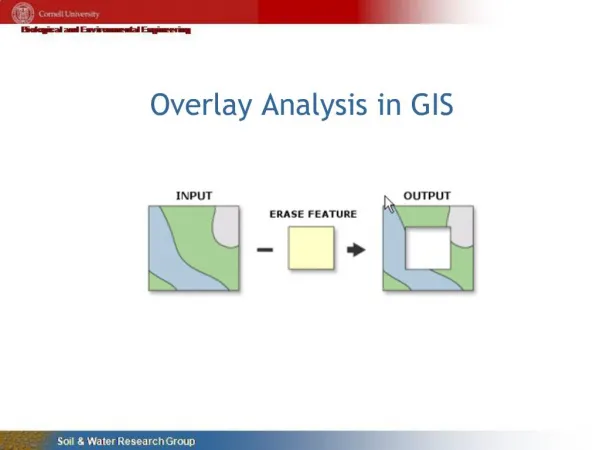
2. Overlay Functions • Arithmetic • addition, subtraction, division, multiplication • Logical • find where specified conditions occur (and, or, >, <, etc.) • Raster & Vector methods differ • Vector good for sparse data sets • Raster grid calculations easier • Overlay(demo – addition)
Overlay: Combining Attributes Select attributes of interest for a given location (Raster & vector methods do this differently, but the results are similar)
Overlay: 4 Basic Rules #1 Enumeration Rule: Each Attribute preserved in output #2 Dominance Rule: One value wins
Overlay: 4 Basic Rules #3 Contributory Rule: each attribute value contributes to result #4 Interaction Rule: pair of values contribute to result
Vector based Overlay • 3 main types of vector overlay • point-in-polygon • line-in-polygon • polygon-on-polygon
Vector based overlay point-in-polygon example
Vector based overlay line-in-polygon example
Vector based overlay polygon-in-polygon example
Raster Based Overlay:Simple Addition Image Source: Chrisman, Nicholas.(2002). 2nd Ed. Exploring Geographic Information Systems. p 144. fig. 5-12.
Raster Overlay: Boolean Combine Image Source: Chrisman, Nicholas.(2002). 2nd Ed. Exploring Geographic Information Systems. p 125. fig. 5-3.
Vector Overlay: Composite Structure Image Source: Chrisman, Nicholas.(2002). 2nd Ed. Exploring Geographic Information Systems. p 127. fig. 5-5.
3. Neighborhood Functions • Basic Functions • Average, diversity, majority, minimum/maximum, and total • Parameters to define: • Target location(s) • Specification of neighborhood • Function to perform on neighborhood elements
3. Neighborhood Function (cont) • Search Operation • most common neighborhood operation • Example • count the number of customers within 2 miles of the grocery store
3. Neighborhood Functions (cont) • Point or Line in Polygon Operation • Vector Model • specialized search function • Raster Model • polygons one data layer • points or lines in separate data layer • Buffers(demo - point, line, polygon)
3. Neighborhood Functions (cont) • Thiessen Polygons Operation • defines the individual area of influence around a point • used to predict values at surrounding points from a single point observation • can produce polygons with shapes unrelated to phenomenon being mapped
Example: Neighborhood Function Thiessen Polygons
Neighborhood Functions:Implementing Used for calculating the mean, standard deviation, sum, or range of values within the immediate or extended neighborhoods.
Neighborhood Functions:Example Zone theme: Watersheds Value theme: Elevation Statistic type: Mean Output: Mean elevation of each watershed
4. Connectivity Functions • Used to accumulate values over an area being navigated • Parameters to define: • specification of way spatial elements are connected • rules that specify allowed movement along interconnections • a unit of measurement
4. Connectivity Functions (cont). • Proximity Operation • measure of the distance between features • not restricted to distance; can be noise, time, pollution, etc. • Parameters to define: • target location • unit of measure • function to calculate proximity (distance/time/noise) • area to be analyzed
Example: Connectivity (Raster) Proximity Operation: Distance From Neighbor
Example: Connectivity (Vector) Proximity Operation: Road Buffer
Example: Connectivity (Vector) Proximity Operation: Buffer Generation
Example: Connectivity (Vector) Proximity Operation: Buffer Types Points Lines Polygons
Example: Connectivity (Vector) Proximity Operation - Buffers & Setbacks Diagram of simple buffers and a setback. NOTE: buffers go outward from lines or areas; setbacks run inside of areas (not lines). Image Source: Chrisman, Nicholas.(2002). 2nd Ed. Exploring Geographic Information Systems. p 154. fig. 6-1.
4. Connectivity Functions (cont). • Contiguity Operation • spatial units are connected - defines “unbroken area” • Contiguity measures: • size of neighboring area(s) • shortest/longest straight line distance across adjacent area(s) • specific shape of neighboring area(s)
Contiguity Functions Combines adjacent units together when they share a common attribute
4. Connectivity Functions (cont). • Network Operations • set of interconnected lines that represent a set of features through which resources flow • Common network functions • shortest path problem (route optimization) • location-allocation modeling (resource allocation) • traveling salesperson problem (route optimization) • route tracing (prediction of network loading)
Example: Connectivity (Vector) Network Function: Location-Allocation
Spread Functions: Travel Time – Friction Surface Friction Surface Data Layer Start Point Data Layer Cumulative Travel Time Data Layer