Download
1 / 8
80 likes | 189 Vues
Supplementary Figure 1. A. SU-DHL4. AKT-CA. pUSE. Myr -AKT. AKT. Endogenous AKT. Tub. B. SU-DHL4 pUSE. 50. SU-DHL4 AKT-CA. *. 40. *. % dead cells. 30. 20. 10. 0. 0. 10. 15. 25. 40. [ Panobinostat ] ( nM ). Supplementary Figure 2. A. B. C. 100. SU-DHL4. 80. *.

E N D
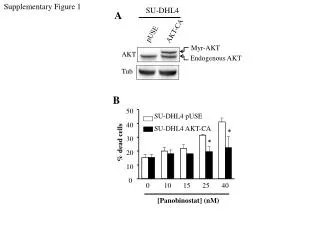
Supplementary Figure 1 A SU-DHL4 AKT-CA pUSE Myr-AKT AKT Endogenous AKT Tub B SU-DHL4 pUSE 50 SU-DHL4 AKT-CA * 40 * % dead cells 30 20 10 0 0 10 15 25 40 [Panobinostat] (nM)
Supplementary Figure 2 A B C 100 SU-DHL4 80 * SU-DHL4 60 SU-DHL16 Viability (% controls) OCI-LY18 1.2 40 HBL-1 1.0 0.8 0.9 CI 20 0.6 0.4 0.6 0.2 1.0 CI 0 0 1.0 0.8 Jeko-1 C IPI SB 0 0.2 0.4 0.6 0.8 1.0 CAL 0.3 CI 0.6 0.8 SB/CAL SB/IPI Fractional Effect 0.4 OCI-LY18 0.6 D E F CI 0.2 0 0.4 0 0 0.2 0.4 0.6 0.8 1.0 0.2 1.0 0 0.2 0.4 0.6 0.8 1.0 0 Fractional Effect 0.8 Fractional Effect 0 0.2 0.4 0.6 0.8 1.0 0.6 CI Fractional Effect 0.4 HBL-1 0.2 SU-DHL16 0 0 0.2 0.4 0.6 0.8 1.0 Fractional Effect Fractional Effect
Supplementary Figure 3 OCI-LY7 4h 8h BZ PB BZ PB C BZ PB C BZ PB p-AKT AKT p21 Ac-H3 H3 Ac-H4 p-H2A.X Tub
Supplementary Figure 4 B C A SU-DHL4 SU-DHL16 SU-DHL4 D BZ * * 80 * shGFP PB * shBim 60 Mcl-1 * 80 * % dead cells shGFP Bcl-2 % dead cells * 40 shBim 60 Viability (% controls) * Bcl-xL 20 40 Tub 0 0 250 500 1000 2000 20 shGFP [BEZ235] nM [Panobinostat] nM shBim 0 0.0 12.5 25.0 50.0 SU-DHL16 SU-DHL4 E 100 shBim shGFP BZ PB BZ PB C BZ PB C BZ PB 50 - - + + - - + + Bim 0 C-casp3 C BZ PB BZ/PB C BZ PB BZ/PB Tub
Supplementary Figure 5 Lysates BZ PB IGG C BZ PB Bcl-2 IP: Bim Bcl-xL Bim Mcl-1 IP: Bak Bcl-xL Bak Mcl-1 Bcl-2 IP: Bax Bcl-xL Bax
Supplementary Figure 6 A B 100 shGFP 100 shBak 80 shGFP shBax shBak 80 60 shBax Viability (% controls) 60 40 Viability (% controls) 40 20 * * 20 * * * 0 0 6.25 12.5 25.0 50.0 0 [Panobinostat] nM 0 250 500 1000 2000 [BEZ235] nM C D 100 100 shGFP shGFP * * shBak * 80 shBak * * 80 shBax shBax * 60 60 % dead cells % dead cells 40 40 20 20 0 0 6.25 0 250 500 1000 2000 0 12.5 25.0 50.0 [BEZ-235] nM [Panobinostat] nM
Supplementary Figure 7 50 100 RM HS-5 CM 40 B A 75 30 Viability (% controls) 50 * % dead cells * 20 25 10 - - - + + + - - - + + + 0 - - - - - - + + + + + + BZ 0 PB C Doxo C Doxo HBL-1 SU-DHL4 OCI-LY18 SU-DHL4 HBL-1 RM CM
0 Supplementary Figure 8 50 C BZ PB Treatment intervals (days) BZ/PB 25 Weight (g) 0 10 20 30 40 50 60 70


