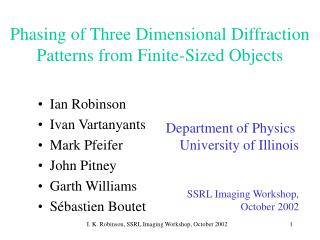
Phasing based on anomalous diffraction Zbigniew Dauter
Phasing based on anomalous diffraction Zbigniew Dauter. Structure factor. F P (h) = S j f j . exp (2 p ih • r j ) f j = f º j ( q ) . exp(-B . sin 2 q / l 2 ). Structure factor with heavy atoms.

Phasing based on anomalous diffraction Zbigniew Dauter
E N D
Presentation Transcript
Phasing based on anomalous diffraction Zbigniew Dauter
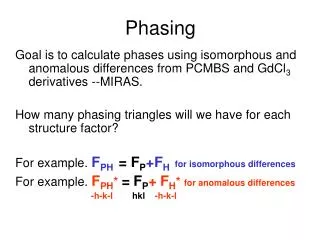
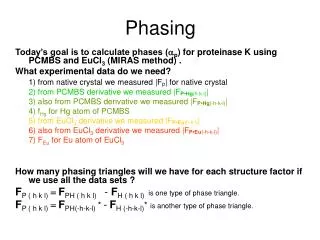
Structure factor FP(h) = Sj fj. exp (2pih•rj) fj = fºj(q). exp(-B.sin2q/l2)
Structure factor with heavy atoms FPH(h) = Sj fj. exp (2pih•rj) + Sk fk. exp (2pih•rk) FPH(h) = FP(h) + FH(h) |FPH|≠ |FP| + |FH|
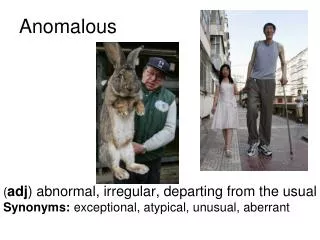
Anomalous diffraction normal scattering q q anomalous(resonant) scattering
Structure factor and anomalous effect F(h) = Sj fj.exp(2pih•rj) fj = fºj(q) + f’j (l) + i.f”j (l) Anomalous correction f” is proportional to absorption and fluorescence and f’ is its derivative
Structure factor and anomalous vectors FT(h) = Sj fj. exp (2pih•rj) +Sk(fok + f’k + i.f”k). exp (2pih•rk)
Structure factor and anomalous effect FT = FN + FA + F’A + i.F”A Anomalous correction i.f” shifts the phase of atomic contribution in positive direction
Friedel pair – F(h) and F(-h) Anomalous correction f” causes the positive shift of phase of both F(h) and F(-h) in effect |FT(h)| ≠ |FT(-h)| jT(h) ≠ -jT(-h)
Friedel pair – F(h) and *F(-h) |FT(h)| ≠ |FT(-h)| jT(h) ≠ -jT(-h)
Friedel pair – more realistically fº(S) = 16 f”(S) = 0.56 for l = 1.54 Å fº(Hg) = 82 f”(Hg) ≈ 4.5 for l < 1.0 Å
Bijvoet difference DF±= |F+| - |F-|
DF depends on phase difference DF±= 2F”A DF±= 0
Sinusoidal dependence of DF and FA DF±≈2.F”A.sin (jT- jA)
Partial structure of anomalous atoms Anomalous atoms can be located by Patterson or direct methods, since: DF±≈2.F”A.sin (jT- jA) |DF±|2≈ 4.dA2.FA2.sin2 (jT - jA) ≈ 2.dA2.FA2 - 2.dA2.FA2.cos[2(jT – jA)] where dA = f”A/foA sin2a = ½ - ½.cos2a and anomalous atoms are mutually distant (even low resolution is “atomic”)
Two solutions for a single l (SAD) If anomalous sites are known (DF±, FA, F’A, F”A,jA) there are two possible phase solutions
Selection of mean phase |FSAD| = |FT|.cos[½(jT1 – jT2)] jSAD = ½ (jT1 + jT2) FOM = cos[ ½ (jT1 – jT2)]
Electron density is then a superpositionof correct structure and noise F1 F2 F1 + F2 iterative solvent flattening indicates correct phase
With errors in measured F+ snd F- With measurement errors and inaccurate anomalous sites the phase indications are not sharp
Phase probability Each phase has then certain probability
Symmetric SAD probability The phase probability is symmetric around jSAD has two maxima
Two solutions not equivalent Vectors FN have different lengths Solution with jT closer to jA is more probable (Sim contribution)
Total SAD probability One solution is slightly more probable (depending how large is the substructure)
Excitation spectrum of Se(not fluorescence spectrum) inflection f’ = -10.5 f” = 2.5 peak f’ = -4.0 f” = 8.0 remote f’ = -0.5 f” = 4.5
Typical MAD wavelengths inflection f’ = -10.5 f” = 2.5 peak f’ = -4.0 f” = 8.0 remote f’ = -0.5 f” = 4.5
Analytical MAD approach(Karle & Hendrickson) FT(±)2 = FT2 + a(l) . FA2 + b(l) . FT.FA .cos (jT - jA) ± c(l) . FT .FA . sin (jT - jA) a(l) = (f’2 + f”2)/fo2 b(l) = 2.f’/fo c(l) = 2.f”/fo Three unknowns: FT, FA and (jT - jA) - system can be solved, and FA used for finding anomalous sites jA (and jT) can then be calculated
MAD treated as MIR Data from different l can be treated as separate derivatives and one native and universal programs (SHARP, SOLVE etc) used for phasing - perfect isomorphism (one crystal) - synchrotron necessary (tunable l) - radiation damage (with long exposures)
Comparison MIR MAD SAD home lab or SR synchrotron home lab or SR several crystals one crystal, 2-3 data one data set non-isomorphism perfect isomorphism perfect isomorphism radiation damage ? radiation damage rad. dam. less acute tedious h.a. search easier easy, if works All methods easy thanks to excellent programs SHELXD/E, SnB, SHARP, SOLVE, CNS, PHENIX, CCP4 etc.
First SAD result crambin Hendrickson & Teeter, 1981 6 S among 46 amino acids l=1.54 Å, f”(S)=0.56, <DF>/<F>=1.4%
SAD vs. MAD Rice, Earnest & Brünger (2000) re-solved 7 SeMAD structures with SAD and recommended collecting first complete peak data set, and then other MAD wavelengths data, as a sort of insurance policy 1.5-wavelength approach (2002) collecting peak data and rapid phasing, if successful, postponement of next l (now it may be < 1-wavelength)
David Blow in 2001 David Blow, Methods Enzymol.374, 3-22 (2003) “How Bijvoet made the difference ?” (written probably in 2001) . . . The future of SAD It seems likely, however, that the various improvements to analyze MAD data more correctly are fading into insignificance. The MAD technique is losing ground to SAD. . . .
SAD/(SAD+MAD) in PDB 11% 22% 32% 45% 55% 2001 2002 2003 2004 2005
Proteinase K data 279 amino acids, 1 Ca + 10 S <DF>/<F> = 0.44 %
Proteinase K - SHELXD Anomalous difference Fourier Results of SHELXD
Proteinase K - SHELXE Experimental map after SHELXE Mean phase error 27.5o
Indicators of anomalous signal - Bijvoet amplitude or intensity ratio - Ranom - c2 difference if Friedels merged - list of outliers - measurability - anomalous signal to noise ratio - correlation between data sets - relation between signal in acentrics and centrics
Bijvoet ratio and Ranom <DF±>/<F> = (2 NA/NP)1/2. (fA”/6.7) Ranom = S (F+ - F-) / S (F+ + F-)/2 Four data sets from glucose isomerase 1 Mn in 375 a.a.
Merging c2 difference and Rmerge crystal soaked in Ta6Br12 cluster compound blue – c2 red - Rmerge when Friedels independent orange – c2 green - Rmerge when Friedels equivalent
List of outliers If redundancy if high enough, clearly shows anomalous differences
Signal-to-noise ratio (DF±)/s(DF) for proteinase K requires proper estimation of s’s (which is not trivial) signal is meaningful, if this ratio is > 1.3
Correlation between data sets corr (DF1±, DF2±) F1 and F2 may be at different MAD l or merged partial SAD data If higher than 25 - 30% - meaningful (advocated by George Sheldrick for SHELXD resolution cutoff)
No indicator is fully satisfactory These indicators of anomalous signal do not tell if the signal is sufficient for structure solution e.g. difficulties with Cu-thionein (Vito Calderone) 8 Cu in ~53 a.a. (12 Cys), P4332 eventually solved from extremely redundant data
Perfect indicator only one satisfactory indicator of anomalous signal exists: successful structure solution nowadays the structure can be solved in few minutes, when the crystal is still at the beam line