4-1 Continuous Random Variables
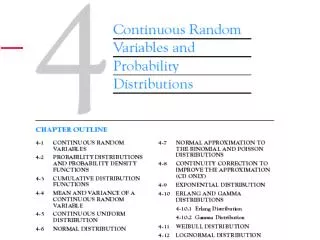
This comprehensive overview explores continuous random variables, probability distributions, and probability density functions. Key concepts include the density function for a loading on a beam, cumulative distribution functions (CDF), as well as the mean and variance of continuous random variables. Detailed examples illustrate the continuous uniform and normal distributions, including their properties and applications in real-world scenarios. The material also covers normal approximations to binomial and Poisson distributions, essential for statistical analysis in various fields.

4-1 Continuous Random Variables
E N D
Presentation Transcript
4-2 Probability Distributions and Probability Density Functions Figure 4-1Density function of a loading on a long, thin beam.
4-2 Probability Distributions and Probability Density Functions Figure 4-2Probability determined from the area under f(x).
4-2 Probability Distributions and Probability Density Functions Definition
4-2 Probability Distributions and Probability Density Functions Figure 4-3Histogram approximates a probability density function.
4-2 Probability Distributions and Probability Density Functions
4-2 Probability Distributions and Probability Density Functions Example 4-2
4-2 Probability Distributions and Probability Density Functions Figure 4-5Probability density function for Example 4-2.
4-2 Probability Distributions and Probability Density Functions Example 4-2 (continued)
4-3 Cumulative Distribution Functions Definition
4-3 Cumulative Distribution Functions Example 4-4
Practice: The pdf for a r.v X is given by f(x) = c x^2, 0≤x≤2 • Find c • Find p(X≤3) • Find CDF of f(x) • Use CDF to find pdf of X
4-4 Mean and Variance of a Continuous Random Variable Definition
4-4 Mean and Variance of a Continuous Random Variable Example 4-6
4-4 Mean and Variance of a Continuous Random Variable Expected Value of a Function of a Continuous Random Variable
4-4 Mean and Variance of a Continuous Random Variable Example 4-8
4-5 Continuous Uniform Random Variable Definition
4-5 Continuous Uniform Random Variable Figure 4-8Continuous uniform probability density function.
4-5 Continuous Uniform Random Variable Mean and Variance
4-5 Continuous Uniform Random Variable Example 4-9
4-5 Continuous Uniform Random Variable Figure 4-9Probability for Example 4-9.
4-6 Normal Distribution Definition
4-6 Normal Distribution Figure 4-10Normal probability density functions for selected values of the parameters and 2.
4-6 Normal Distribution Some useful results concerning the normal distribution
4-6 Normal Distribution Definition : Standard Normal
4-6 Normal Distribution Example 4-11 Figure 4-13Standard normal probability density function.
Example:Let Z be a standard normal rv N(0,1), determine the following • p(Z ≤1.26) • p(Z>1.26) • p(Z>-1.26) • P(-1.26<Z<1.26) • Find value z such that p(Z>z) =.05 • Find z such that p(-z<Z<z)=.95
4-6 Normal Distribution Example 4-13
4-6 Normal Distribution Figure 4-15Standardizing a normal random variable.
4-6 Normal Distribution To Calculate Probability
4-6 Normal Distribution Example 4-14
4-6 Normal Distribution Example 4-14 (continued)
4-6 Normal Distribution Example 4-14 (continued) Figure 4-16Determining the value of x to meet a specified probability.
4-7 Normal Approximation to the Binomial and Poisson Distributions • Under certain conditions, the normal distribution can be used to approximate the binomial distribution and the Poisson distribution.
4-7 Normal Approximation to the Binomial and Poisson Distributions Figure 4-19Normal approximation to the binomial.
4-7 Normal Approximation to the Binomial and Poisson Distributions Example 4-17
4-7 Normal Approximation to the Binomial and Poisson Distributions Normal Approximation to the Binomial Distribution
4-7 Normal Approximation to the Binomial and Poisson Distributions Example 4-18
4-7 Normal Approximation to the Binomial and Poisson Distributions Figure 4-21Conditions for approximating hypergeometric and binomial probabilities.
4-7 Normal Approximation to the Binomial and Poisson Distributions Normal Approximation to the Poisson Distribution
4-7 Normal Approximation to the Binomial and Poisson Distributions Example 4-20
4-8 Exponential Distribution Definition
4-8 Exponential Distribution Mean and Variance
4-8 Exponential Distribution Example 4-21
4-8 Exponential Distribution Figure 4-23Probability for the exponential distribution in Example 4-21.