Understanding Statistics: Sampling Methods and Experimental Design
Dive into statistics with an overview of variables, levels of measurement, random sampling methods, and experimental design. Learn about census, simulations, observational studies, and experiments to interpret numerical information effectively.

Understanding Statistics: Sampling Methods and Experimental Design
E N D
Presentation Transcript
Getting Started Chapter 1 Observation that the firefly population is declining
1.1 What is Statistics? • Statistics – study of how to collect , organize, analyze, and interpret numerical information from data. • Individuals – people or objects in the study • Variable – characteristic of individual to be measured or observed • Quantitative – has a value or numerical measurement for which operations such as addition or averaging makes sense • Qualitative (or categorical) – places an individual in a category or group (Gender, left vs right handed, senior vs junior) Normally listed as percentages or proportions
1.1 What is Statistics? • Population Data – data from every individual of interest (census) • Sample Data – data from only some of the individuals of interest • Ex p. 6
1.1 What is Statistics? • Levels of measurement • Nominal Level • consists of names, labels, or categories • cannot be put in order from smallest to largest • Ordinal • Data that can be arranged in order • Differences between data values cannot be determined or are meaningless • Ex. Rankings in class or good, better, best • Interval • data that can be arranged in order and differences between data values are meaningful • Ex. Temperatures, dates • Ratio – • data can be arranged in order; both differences and ratios of data values are meaningful. Data has true zero • Ex Length, age, salary • Helpful hint: to determine which level an example belongs to, start at the most stringent, ratio Ex p8 Homework p 10 1-9,
1.2 Random Samples • Simple Random Sample (SRS) • Sample size n from population • Every sample of size n has an equal chance of being selected • Every member of the population has an equal chance of being included in the sample
1.2 Random Samples • Random Number Table • Number all members of population sequentially • Use a table, calculator, or computer to select random numbers • Create sample by selecting members from population with corresponding numbers
1.2 Random Samples Methods for finding random sample • Table 1 in appendix (right after p 526)depends on number of digits in total populatione.g. a) select 2 out of 10 items (use digits 0-9) b) pick 5 out of 40 (use digits 01 to 40) 2 digits at a time c)pick 25 out of 800 (use 3 digits 001 to 800) • Put names, numbers in a hat; pick out n names • Use randint or calculator
1.2 Random Samples • Sampling techniques • Simulation – numerical facsimile or representation of a real-world phenomenon • Heads or tails (0-4 H, 5-9 T) use table • Rolling a die (1-6 represent die value; ignore 0,7,8,9) • Computer driven (events following nuclear bomb) in class p17, 6 • Stratified Sampling • Break population into strata – groups that show a common characteristic (male/female or Junior/senior) • Take SRS from each strata n usually based on proportionate size of strata Advantage –can be better than SRS assuming strata all behave similarly (assured of setting representative sample of all groups) Can analyze within strata
1.2 Random Samples • Sampling Techniques • Systematic Sampling • Arrange population in some natural sequential order (people waiting in line) • Start at random in front of line and select ever “nth” subject • Cluster sampling • Divide some area into sections • Take SRS of sections to be analyzed • Sample everyone in section Advantage cheaper with some randomness • Convenience sampling • Sample from population members that are readily available • First 20 people seen; your friends • Homework p17 2,4,6,8,9,10,11
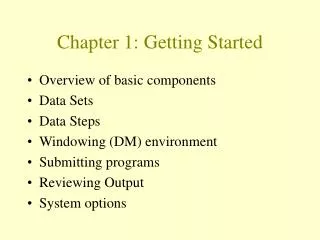
1.3 Introduction to Experimental Design • Planning a Statistical Study • Identify individuals or objects of interest • Specify variables as sell as protocols for taking measurements or making observations • Determine if you will use entire population or a representative sample If using a sample, decide on a viable sampling method • Address issues of ethics, confidentiality, privacy, getting truthful responses etc in your data collection plan • Collect data • Use appropriate statistical methods to describe data and to make conclusions (infer)
1.3 Introduction to Experimental Design • Types of studies • Census – measurements or observations from entire population are used • Sample – only part of the population is used • Simulation – numerical facsimile of real world phenomena • Real study will be dangerous (result of catastrophe) • Cheaper to get rough idea of effect • Observational Study – observations and measurements of individuals are conducted in a way that does not change response or variable being measured (poll, driving time to work) • Experiment – impose a treatment or individuals in order to observe a possible change in the response or variable being measured (e.g. medical studies; effect of studying techniques or grades)
1.3 Introduction to Experimental Design • Experiments – properly designed experiments require: • Control – A control group is needed to evaluate the relative effect of the treatment. It helps to account for the influence of other known or unknown variables that might be a underlying cause of a change in response or experimental group. These hidden variables are called lurking or confounding variables. (ice cream sales vs. drowning) • Placebo effect – some control groups are given a placebo (fake or dummy pill that looks like treatment but is inactive). Subject receives no treatment but believes they are and in fact responds favorably. • Randomization – normally use volunteer to prevent bias, individuals aree assigned at random to both control and treatment groups. - helps to even out any differences in the individuals
1.3 Introduction to Experimental Design • After Control and Randomization… • Replication – use many patients in both groups to reduce the possibility that differences in “pain relief” for the 2 groups occurred by chance alone. Other terms: Double blind study – experiment where neither the individuals in the study nor the observers (doctors) know which treatment subjects are receiving. This helps control for subtle biases that a doctor might pass on to a patient. Bias – Systematically favors certain outcomes
1.3 Introduction to Experimental Design Diagramming an experiment: Randomized two treatment experiment Premise: doctors think magnets may reduce pain in polio patients Active Magnet 50 100 polio randomly evaluate pain Patients assigned level 50 Placebo – inactive magnet
1.3 Introduction to Experimental Design • Matched pairs Design • Compare 2 treatments • Subjects are matched in way to reduce variation • Allow subjects to receive 2 treatments one after another Randomly assign which treatment is given first Treatment 1 Treatment 2 Randomly 20 70 ° Evaluate 90 ° compare Assign productivity productivity Workers 20 Treatment 1 Treatment 2 90 ° 70 ° Good example: weight loss programs weigh subject before and after.
1.3 Introduction to Experimental Design • Block Designs • Block Group of subjects that are known to be similar in some way and are expected to affect response of variables • Random assignment to treatments done within each block • Typically separate men/women in medical treatments Ex: 50 men and 80 women for blood pressure medicine 25 BP treatment Compare Men 25 Placebo results Subject 50 Randomized 8040 BP treatment Compare Women 40 Placebo results
1.3 Introduction to Experimental Design Bias –systematically favors certain outcomes: • Voluntary Response Sample: people choose themselves by responding voluntarily Ex. Normally people with strong opinions (radio talk shows) • Convenience Sampling: contacts individuals easiest to reach (surveys at malls) • Nonresponse: people refuse to answer questions • Undercoverage: misses certain segments of population (phone surveys miss people without phones) • Response Bias: Respondent lies: behavior of interviewer could affect respondent • Poorly worded questions (or order of questions): can lead respondent to certain responses • Generalizing results beyond population surveyed • Test on rats; will work on people • Survey students of FRHS on presidential election to know next president