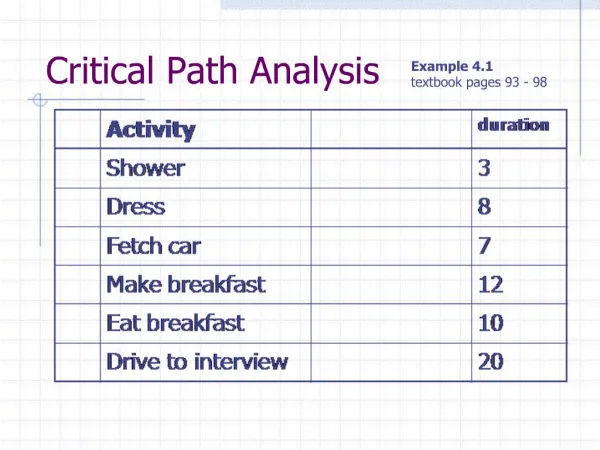
Path Analysis
Path Analysis. Frühling Rijsdijk. Biometrical Genetic Theory. Aims of session: Derivation of Predicted Var/Cov matrices Using: Path Tracing Rules Covariance Algebra. model building. Twin Model. Path Diagrams. System of Linear Equations. Covariance Algebra. Path Tracing Rules.

Path Analysis
E N D
Presentation Transcript
Path Analysis Frühling Rijsdijk
Biometrical Genetic Theory Aims of session: • Derivation of Predicted Var/Cov matrices Using: • Path Tracing Rules • Covariance Algebra model building Twin Model Path Diagrams System of Linear Equations Covariance Algebra Path Tracing Rules Predicted Var/Cov of the Model Observed Var/Cov of the Data SEM
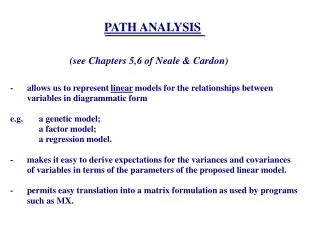
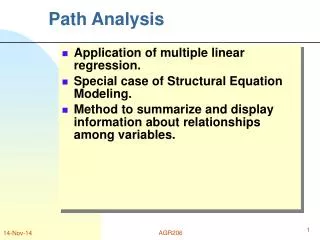
Method of Path Analysis • Allows us to represent linear models for the relationship between variables in diagrammatic form, e.g. a genetic model; a factor model; a regression model • Makes it easy to derive expectations for the variances and covariances of variables in terms of the parameters of the proposed linear model • Permits easy translation into matrix formulation as used by programs such as Mx, OpenMx.
VX X VE=1 E e a Y Y = aX + eE Conventions of Path Analysis I • Squares or rectangles denote observed variables • Circles or ellipses denote latent (unmeasured) variables • Upper-case letters are used to denote variables • Lower-case letters (or numeric values) are used to denote covariances or path coefficients • Single-headed arrows or paths (–>) represent hypothesized causal relationships - where the variable at the tail is hypothesized to have a direct causal influence on the variable at the head
r VZ VX X Z a b VE=1 e E Y Conventions of Path Analysis II • Double-headed arrows (<–>) are used to represent a covariance between two variables, which may arise through common causes not represented in the model. • Double-headed arrows may also be used to represent the variance of a variable. Y = aX + bZ + eE
r VZ VX X Z a b VE=1 e E Y Conventions of Path Analysis III • Variables that do not receive causal input from any one variable in the diagram are referred to as independent,orpredictoror exogenous variables. • Variables that do, are referred to as dependentorendogenousvariables. • Only independent variables are connected by double-headed arrows. • Single-headed arrows may be drawn from independent to dependent variables or from dependent variables to other dependent variables.
Conventions of Path Analysis IV • Omission of a two-headed arrow between two independent variables implies the assumption that the covariance of those variables is zero • Omission of a direct path from an independent (or dependent) variable to a dependent variable implies that there is no direct causal effect of the former on the latter variable
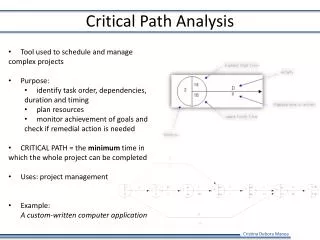
Path Tracing The covariance between any two variables is the sum of all legitimate chains connecting the variables The numerical value of a chain is the product of all traced path coefficients in it A legitimate chain is a path along arrows that follow 3 rules:
(i) Trace backward, then forward, or simply forward from one variable to another. NEVER forward then backward! Include double-headed arrows from the independent variables to itself. These variances will be 1 for latent variables • Loops are not allowed, i.e. we can not trace twice through • the same variable (iii) There is a maximum of one curved arrow per path. So, the double-headed arrow from the independent variable to itself is included, unless the chain includes another double-headed arrow (e.g. a correlation path)
The Variance Since the variance of a variable is the covariance of the variable with itself, the expected variance will be the sum of all paths from the variable to itself, which follow the path tracing rules
q p 1 1 1 D E F o n k m l A B C • Cov AB = kl + mqn + mpl • Cov BC = no • Cov AC = mqo • Var A = k2 + m2 + 2 kpm • Var B = l2 + n2 • Var C = o2
Quantitative Genetic Theory • There are two sources of Genetic influences: Additive (A)and non-additive orDominance (D) • There are two sources of environmental influences: Common or shared(C) and non-shared or unique(E) 1 1 1 1 A D C E a d c e P PHENOTYPE
In the preceding diagram… • A, D, C, E are independentvariables • A = Additive genetic influences • D = Non-additive genetic influences (i.e., dominance) • C = Shared environmental influences • E = Non-shared environmental influences • A, D, C, E have variances of 1 • Phenotype is a dependent variable • P = phenotype; the measured variable • a, d, c, e are parameter estimates
Model for MZ Pairs Reared Together 1 1 C A C E E A 1 1 1 1 1 1 e a e c a c PTwin 1 PTwin 2 Note: a, c and e are the same cross twins
Model for DZ Pairs Reared Together 1 .5 C A C E E A 1 1 1 1 1 1 e a e c a c PTwin 1 PTwin 2 Note: a, c and e are also the same cross groups
Variance of Twin 1 AND Twin 2 (for MZ and DZ pairs) C A E 1 1 1 e c a PTwin 1
Variance of Twin 1 AND Twin 2 (for MZ and DZ pairs) C A E 1 1 1 e c a PTwin 1
Variance of Twin 1 AND Twin 2 (for MZ and DZ pairs) C A E 1 1 1 e c a PTwin 1
Variance of Twin 1 AND Twin 2 (for MZ and DZ pairs) a*1*a = a2 C A E 1 1 1 + e c a PTwin 1
Variance of Twin 1 AND Twin 2 (for MZ and DZ pairs) a*1*a = a2 C A E 1 1 1 + c*1*c = c2 e c a + e*1*e = e2 PTwin 1 Total Variance = a2 + c2 + e2
Covariance Twin 1-2: MZ pairs 1 1 C A C E E A 1 1 1 1 1 1 a e c a c e PTwin 1 PTwin 2
Covariance Twin 1-2: MZ pairs 1 1 C A C E E A 1 1 1 1 1 1 a e c a c e PTwin 1 PTwin 2
Covariance Twin 1-2: MZ pairs 1 1 C A C E E A 1 1 1 1 1 1 a e c a c e PTwin 1 PTwin 2 Total Covariance = a2 +
Covariance Twin 1-2: MZ pairs 1 1 C A C E E A 1 1 1 1 1 1 a e c a c e PTwin 1 PTwin 2 Total Covariance = a2 + c2
Covariance Twin 1-2: DZ pairs 1 .5 C A C E E A 1 1 1 1 1 1 a e c a c e PTwin 1 PTwin 2 Total Covariance = .5a2 + c2
Predicted Var-Cov Matrices Tw1 Tw2 Tw1 Tw2 Tw1 Tw2 Tw1 Tw2
ADE Model 1(MZ) / 0.25 (DZ) 1/.5 D A D E E A 1 1 1 1 1 1 e a e d a d PTwin 1 PTwin 2
Predicted Var-Cov Matrices Tw1 Tw2 Tw1 Tw2 Tw1 Tw2 Tw1 Tw2
ACE or ADE Cov(mz) = a2 + c2or a2 + d2 Cov(dz) = ½ a2 + c2or ½ a2 +¼ d2 VP = a2 + c2 + e2 or a2 + d2 + e2 3 unknown parameters (a, c, e or a, d, e), and only 3 distinct predictive statistics: Cov MZ, Cov DZ, Vp this model is justidentified
Effects of C and D are confounded The twin correlations indicate which of the two components is more likely to fit the data: Cor(mz) = a2 + c2or a2 + d2 Cor(dz) = ½ a2 + c2or ½ a2 +¼ d2 If a2 =.40, c2 =.20 rmz = 0.60 rdz = 0.40 If a2 =.40, d2 =.20 rmz = 0.60 rdz = 0.25 ACE ADE
ADCE: classical twin design + adoption data Cov(mz) = a2 + d2 + c2 Cov(dz) = ½ a2 + ¼ d2 + c2 Cov(adopSibs) = c2 VP = a2 + d2 + c2 + e2 4 unknown parameters (a, c, d, e), and 4 distinct predictive statistics: Cov MZ, Cov DZ, Cov adopSibs, Vp this model is justidentified
Three Fundamental Covariance Algebra Rules Var (X) = Cov(X,X) Cov (aX,bY) = ab Cov(X,Y) Cov (X,Y+Z) = Cov (X,Y) + Cov (X,Z)
Example 1 1 A a Y Y = aA The variance of a dependent variable (Y) caused by independent variable A, is the squared regression coefficient multiplied by the variance of the independent variable
Example 2 .5 1 1 A A a a Y Z Y = aA Z = aA
Summary • Path Tracing and Covariance Algebra have the same aim : to work out the predicted Variances and Covariances of variables, given the specified model • The Ultimate Goal is to fit Predicted Variances / Covariances to observed Variances / Covariances of the data in order to estimate model parameters : • regression coefficients, correlations