Path Analysis
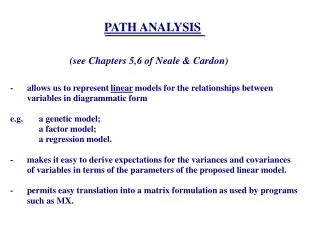
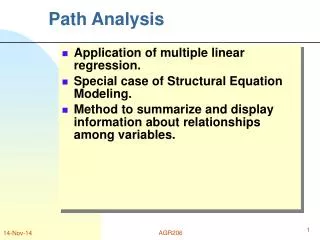
Path Analysis. HGEN619 class 2005. Method of Path Analysis. allows us to represent linear models for the relationship between variables in diagrammatic form, e.g. a genetic model; a factor model; a regression model

Path Analysis
E N D
Presentation Transcript
Path Analysis HGEN619 class 2005
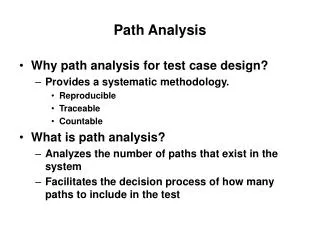
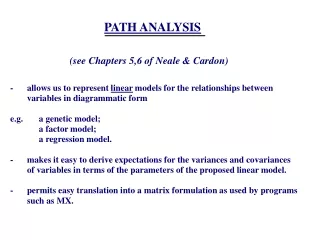
Method of Path Analysis • allows us to represent linear models for the relationship between variables in diagrammatic form, e.g. a genetic model; a factor model; a regression model • makes it easy to derive expectations for the variances and covariances of variables in terms of the parameters of the proposed linear model • permits easy translation into matrix formulation as used by programs such as Mx
Conventions of Path Analysis I • Squares or rectangles denote observed variables. • Circles or ellipses denote latent (unmeasured) variables. • Upper-case letters are used to denote variables. • Lower-case letters (or numeric values) are used to denote covariances or path coefficients.
Conventions of Path Analysis II • Single-headed arrows or paths (–>) are used to represent causal relationships between variables under a particular model - where the variable at the tail is hypothesized to have a direct influence on the variable at the head. • Double-headed arrows (<–>) are used to represent a covariance between two variables, which may arise through common causes not represented in the model. They may also be used to represent the variance of a variable.
Conventions of Path Analysis III • Double-headed arrows may not be used for any variable which has one or more single-headed arrows pointing to it - these variables are called endogenous variables. Other variables are exogenous variables. • Single-headed arrows may be drawn from exogenous to endogenous variables or from endogenous variables to other endogenous variables.
Conventions of Path Analysis IV • Omission of a two-headed arrow between two exogenous variables implies the assumption that the covariance of those variables is zero (e.g., no genotype-environment correlation). • Omission of a direct path from an exogenous (or endogenous) variable to an endogenous variable implies that there is no direct causal effect of the former on the latter variable.
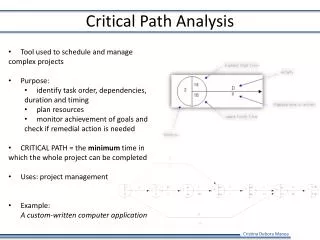
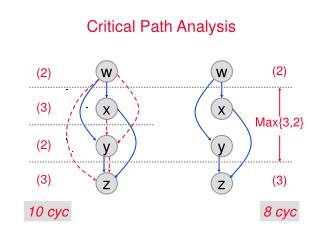
Tracing Rules of Path Analysis • Trace backwards, change direction at a double-headed arrow, then trace forwards. • This implies that we can never trace through double-headed arrows in the same chain. • The expected covariance between two variables, or the expected variance of a variable, is computed by multiplying together all the coefficients in a chain, and then summing over all possible chains.
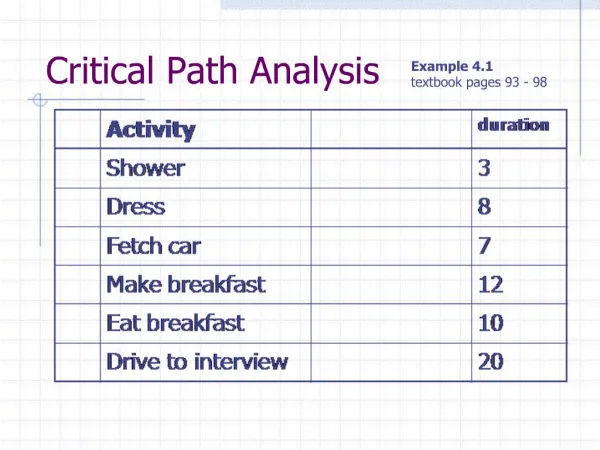
Example p
Exercises • Cov AB = • Cov BC = • Cov AC = • Cov AE = • Var A = • Var B = • Var C = • Var E
Covariance between A and B Cov AB = kl + mqn + mpl
Expectations • Cov AB = kl + mqn + mpl • Cov BC = np • Cov AC = mqp • Cov AE = m + pk • Var A = k2 + m2 + 2 kpm • Var B = l2 + n2 • Var C = p2 • Var E = 1