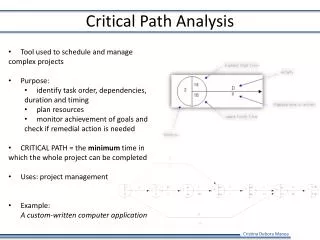
Path Analysis
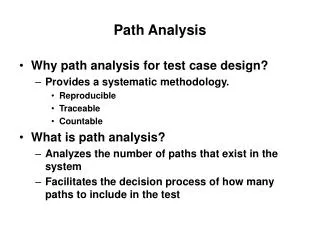
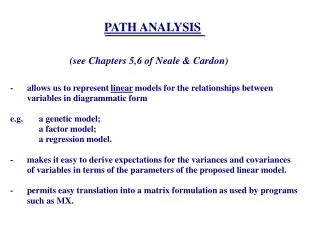
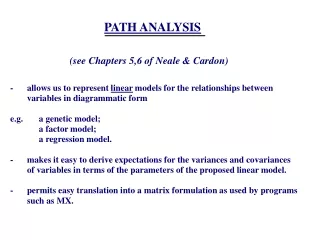
Path Analysis. Application of multiple linear regression. Special case of Structural Equation Modeling. Method to summarize and display information about relationships among variables. Uses of Path Analysis.

Path Analysis
E N D
Presentation Transcript
Path Analysis • Application of multiple linear regression. • Special case of Structural Equation Modeling. • Method to summarize and display information about relationships among variables. AGR206
Uses of Path Analysis • Good presentation tool for results of multiple linear regression where there are intermediate variables and indirect effects because the causal variables are correlated. • Path analysis reflects part of the collinearity among explanatory variables. • To test how well a priori models are supported by the data. It cannot be used to derive the form of the relationships or of the diagram. AGR206
Path analysis is based on MLR • Model: • Y = 0 + 1 X1 + 2 X2 + • Assumptions: • Same as MLR: • Linearity • Normality of errors • Homogeneity of variance • Independence of errors • No outliers AGR206
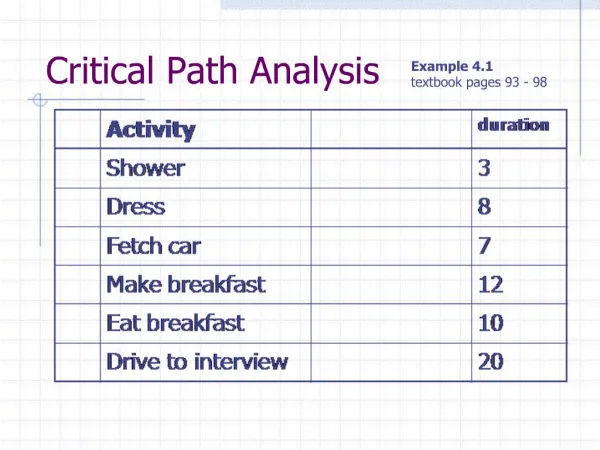
Example: teaching methods • Students were randomly assigned to two teaching methods. • Scores in the exam and degree of motivation were measured. • Objective performance (scores) is affected both by teaching method and motivation. • The new method can work if the negative link with motivation is changed. AGR206
Example: deer bites (on plants!) • Theory indicated that quantity and quality of diet should be negative related. • Study over season with several deer showed no relationship. • Path analysis showed that theory should have been interpreted more carefully, and that relationships were actually present in data. AGR206
Bite size and diet quality 0! Bite Size Diet quality + Deer Size Bite Size - + - Day of season Plant mass Diet quality - - + Plant quality AGR206
Example: yield components Fertility Seeds/flower No. Flowers Yield Water Competitor Density Seed size es/f enf eY ess AGR206
Example: yield or fitness components • A path diagram may have more than one “layer.” • All of the variance and covariance of the endogenous variables is explained by the exogenous variables and the residuals. AGR206
Elements of path diagrams AGR206
Diagram and models • Approaches = b1’ No. flowers + b2’ nectar p.r. + b3’ n. neighbor d. • fruit set = c1’ approaches + c2’ probes + c3’ n. neighbor d. • probes = d1’ appr. + d2’ No. flowers + d3’ nectar p.r. + d4’ n. neighbor d. AGR206
Calculating path values AGR206