Download
1 / 19
200 likes | 231 Vues
Explore a 2-Dimensional model of tumor-induced angiogenesis with factors influencing sprout formation and blood vessel growth. The simulation investigates the impact of Tumor Angiogenic Factors, Proteases, Inhibitors, and ECM interactions on angiogenesis dynamics.

E N D
Modeling of Tumor Induced AngiogenesisII Heather Harrington, Marc Maier & Lé Santha Naidoo Faculty Advisors: Panayotis Kevrekidis & Nathaniel Whitaker
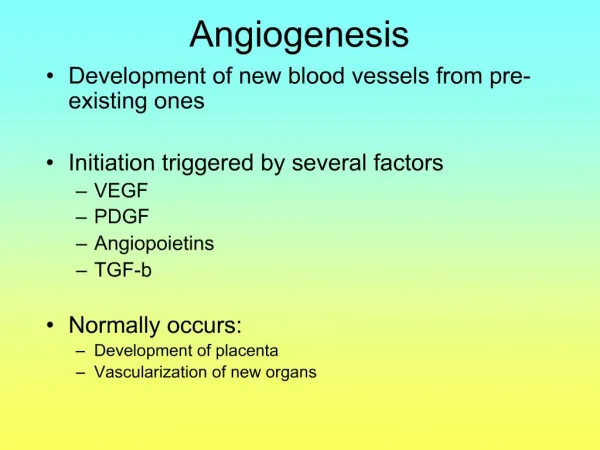
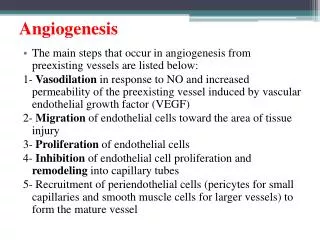
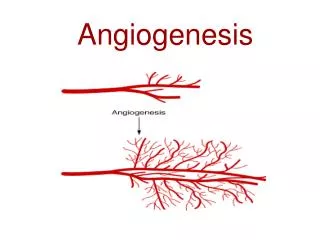
Bio Recap • Angiogenesis: The process of formation of capillary sprouts in response to external chemical stimuli which leads to the formation of blood vessels. • Tumor Angiogenic Factors (TAFs): Stimuli secreted by Tumors • Extra Cellular Matrix (ECM): The area in which cells interact with the Fibronectin(F). • Proteases (P): Secreted by tumor to attract cells and destroy Inhibitors. Promotes Angiogenesis. • Inhibitors: Prevent Cells from getting to tumor. Generated by fibronectin cells in the ECM to inactivate proteases.
(1) Ct = DcΔC – ∂/∂x(fF* ∂F/∂x) - ∂/∂x(fT* ∂T/∂x) + ∂/∂x(fI* ∂I/∂x) + k1C(1-C) (2)T = e(-(x-L)²/ε) (3) Ft = -k2PF (4) Pt = -k3PI + k4TC + k5T – k6P (5) It = -k3PI fT term represents chemotactic attraction of cells to tumor fF term represents haptotactic response to the Fibronectin fI term represents the “repulsive” effect of inhibitor gradients Dc = Diffusion Coefficient fF = a1C fT = a2C/(1 + a3T) fI = a4C 5 “Species” Dynamical Evolution Model (1 Dimension)
After Discretization We Get… • C(n, k+1) = PrC(n-1, k) + PsC(n,k) + PlC(n+1, k) • F(n, k+1) = F(n,k)*(1 – Δt k2 P(n,k) ) • P(n, k+1) = P(n, k) (1 – Δt k6 – Δt k3 I(n,k) + T(n,k) (Δt k4 C (n,k) + Δt k5) • I(n, k+1) = I(n,k) (1 – Δt k3 P(n,k) ) • T = e-(x – L)²/ε (constant)
1 - D results • Near Tumor Far from Tumor No inhibitor
Adding an Inhibitor • Near tumor Far from tumor weak inhibitor
Another Inhibitor • Near tumor Far from tumor Strong Inhibitor
Replenished Inhibitor Examples • Near tumor Far from tumor Weak Inhibitor
Replenished cont… • Near Tumor Far from tumor Strong Inhibitor
5 Species Dynamic Evolution2 Dimensional Model • (1) Ct = DcΔC – (fF* F) - (fT* T) + (fI* I) + k1C(1-C) • (2)T = e(-(x-L)²/ε) • (3) Ft = -k2PF • (4) Pt = -k3PI + k4TC + k5T – k6P • (5) It = -k3PI
After Discretization (2 Dimensions)… • C(n, m, k+1) = Pr C(n-1, m, k) + Pl C(n+1, m, k) + Ps C(n, m, k) + Pu C(n, m-1, k) + Pd C(n, m+1, k) • F(n, m, k+1) = F(n, m, k)*(1 – Δt k2 P(n, m, k) ) • P(n, m, k+1) = P(n, m, k) (1 – Δt k6 – Δt k3 I(n, m, k) + T(n, m, k) (Δt k4 C (n, m, k) + Δt k5) • I(n, m, k+1) = I(n, m, k) (1 – Δt k3 P(n, m, k) ) • T = e-[(x – L)² + (y-L) ²]/ε(constant)
2 – D Results Near Tumor – No Inhibitor
Angiogenesis in the Cornea • ∂C/∂t = DΔC - k C – u L C • D = Diffusion Coefficient C = Tumor Angiogenic Factors (TAF) • k = rate constant of inactivation u = rate constant of uptake • L = total vessel length per unit area ΔC = ∂²C/∂x² + ∂²C/∂y² • f(C) = • Ct = Threshold Concentration α = constant that controls shape of the curve • n = Smax f(C) Δl Δt • (probability for the formation of 1 sprout from a vessel segment) • Smax = rate constant that determines max probability of sprout formation 0, 0 ≤ C ≤ Ct 1 – e-α(C – Ct), Ct ≤ C
Sprout Growth = P + (1-P) • E = direction of growth in previous time step • G = Direction of concentration gradient of TAF • P = Persistance ratio • Δl = Vmax f(C) Δt (Length increase of sprouts) • Vmax = maximum rate of length increase ExT ExoT Gxo T cos θ sin θ Ey Eyo Gyo -sin θ cos θ
Progress & Goals • 1-Dimensional Model with “random walker cells” • 2-Dimensional Model of Angiogenesis • Modeling Angiogenesis in the Cornea (ignoring inhibitors) – In Progress • Angiogenesis in the Cornea with Inhibitors and perhaps other factors