Download
1 / 22
220 likes | 252 Vues
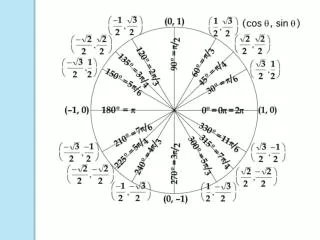
Explore graphs of circular functions like sine, cosine, tangent, secant, and more. Learn how to sketch the graphs effectively using graphing techniques and connecting graphs with equations. Discover vertical asymptotes, periods, and symmetry properties.

E N D
4 Graphs of the Circular Functions
4 Graphs of the Circular Functions • 4.1 Graphs of the Sine and Cosine Functions • 4.2 Translations of the Graphs of the Sine and Cosine Functions • 4.3 Graphs of the Tangent and Cotangent Functions • 4.4 Graphs of the Secant and Cosecant Functions • 4.5 Harmonic Motion
Graphs of the Secant and Cosecant Functions 4.4 Graph of the Secant Function ▪ Graph of the Cosecant Function ▪ Graphing Techniques ▪ Connecting Graphs with Equations ▪ Addition of Ordinates
Secant Function f(x) = sec x • The graph is discontinuous at values of x of the form and has vertical asymptotes at these values. • There are no x-intercepts. • Its period is 2. • Its graph has no amplitude, since there are no minimum or maximum values. • The graph is symmetric with respect to the y-axis, so the function is an even function. For all x in the domain, sec(–x) = sec(x).
Cotangent Function f(x) = cot x • The graph is discontinuous at values of x of the form x = n and has vertical asymptotes at these values. • There are no x-intercepts. • Its period is 2. • Its graph has no amplitude, since there are no minimum or maximum values. • The graph is symmetric with respect to the origin, so the function is an odd function. For all x in the domain, csc(–x) = –csc(x).
To graph the secant function on a graphing calculator, use the identity Secant and Cosecant Functions • To graph the cosecant function on a graphing calculator, use the identity
To Graph Use as a Guide y = a csc bx y = a sin bx y = a sec bx y = cos bx Guidelines for Sketching Graphs of Cosecant and Secant Functions Step 1 Graph the corresponding reciprocal function as a guide, using a dashed curve. Step 2 Sketch the vertical asymptotes. They will have equations of the form x = k, where k is an x-intercept of the graph of the guide function.
Guidelines for Sketching Graphs of Cosecant and Secant Functions Step 3 Sketch the graph of the desired function by drawing the typical U-shaped branches between the adjacent asymptotes. The branches will be above the graph of the guide function when the guide function values are positive and below the graph of the guide function when the guide function values are negative.
Example 1 Step 1 Graph the corresponding reciprocal function The function has amplitude 2 and one period of the graph lies along the interval that satisfies the inequality Divide the interval into four equal parts and determine the key points. GRAPHING y = a sec bx
Example 1 GRAPHING y = a sec bx (continued) Step 2 Sketch the vertical asymptotes. These occur at x-values for which the guide function equals 0, such as x = 3, x = –, x = , x = 3.
Example 1 Step 3 Sketch the graph of by drawing the typical U-shaped branches, approaching the asymptotes. GRAPHING y = a sec bx (continued)
Example 2 Step 1 Graph the corresponding reciprocal function GRAPHING y = a csc (x – d)
Example 2 GRAPHING y = a csc (x – d) (continued) Step 2 Sketch the vertical asymptotes through the x-intercepts of These have the form where n is any integer.
Example 2 GRAPHING y = a csc (x – d) (continued) Step 3 Sketch the graph of by drawing typical U-shaped branches between the asymptotes.
Example 3(a) DETERMINING AN EQUATION FOR A GRAPH Determine an equation for the graph. This graph is that of a cosecant function that is stretched horizontally having period 4π. Therefore, if y = csc bx, where b > 0, we must have b = 1/2. An equation for this graph is
Example 3(b) DETERMINING AN EQUATION FOR A GRAPH Determine an equation for the graph. This is the graph of y = sec x, translated 1 unit upward. An equation for the graph isy = 1 + sec x.
Addition of Ordinates New functions can be formed by adding or subtracting other functions. y = cos x + sin x Graph y = cos x and y = sin x. Then, for selected values of x, plot the points (x, cos x + sin x) and join the resulting points with a sinusoidal curve.