Download
1 / 53
561 likes | 876 Vues
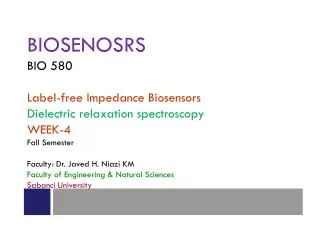
BIOSENOSRS BIO 580 Label-free Impedance Biosensors Dielectric relaxation spectroscopy WEEK-4 Fall Semester Faculty: Dr. Javed H. Niazi KM Faculty of Engineering & Natural Sciences Sabanci University. Label Free Impedance Biosensor. What is Biosensor?.

E N D
BIOSENOSRS BIO 580 Label-free Impedance Biosensors Dielectric relaxation spectroscopy WEEK-4 Fall Semester Faculty: Dr. Javed H. Niazi KM Faculty of Engineering & Natural Sciences Sabanci University
What is Biosensor? A biosensor is a device which detect the bimolecular interactions for different concentrations of probe and target (analyte) and transforms in to a measureablesignal. Typical structure of bio-sensor
BIOSENSOR CLASSIFICATION-I Name of Biosensor Types of Biological Recognition Enzyme electrode Enzymes Proteins Immunosensor Antibodies DNA sensor DNA Organelles Microbial sensor Microbial cells Plant and animal tissues
BIOSENSOR CLASSIFICATION-II Types of Transducers Measured Property ElectrochemicalPotentiometricAmperometric Voltametric Electrical /capacitive/Impedance Dielectric properties Electrolyte conductivity Optical Fluoresence Adsorption Reflection Mass sensitive Resonance frequency of piezocrystals Thermal Heat of reaction Heat of adsorpsion
Electrical biosensors Impedance Voltammetric, Amperometric/Coulometric Impedance biosensors measure theelectrical impedance of an interface in AC steady statewith constant DC bias conditionsoften this is accomplished by imposing a small sinusoidalvoltage at a particular frequency and measuring the resultingcurrent; the process can be repeated at differentfrequencies. The current-voltage ratio gives the impedance.This approach, known as electrochemical impedance spectroscopy(EIS), has been used to study a variety of electrochemicalphenomena over a wide frequency range. If theimpedance of the electrode-solution interface changes whenthe target analyte is captured by the probe, EIS can be usedto detect that impedance change. Alternatively, the impedanceor capacitance of the interface may be measured at asingle frequency. Impedance measurement does not requirespecial reagents and is amenable to label-free operation Voltammetry and amperometry involve measuringthe current at an electrode as a function of appliedelectrode-solution voltage; these approaches are DC orpseudo-DC and intentionally change the electrode conditions
Capacitance/ dielectric charges Ref: Daniels & Pourmand. 2007. Electroanal 19: 1239-1257.
A closely realted but separate class of electrical biosensor Ion-sensitive field-effecttransistors (ISFETs) Enzyme field-effect transistor(EnFETs) Field-effect biosensor (BioFETs) These biosensors are operated by field-effect modulation of carriers in a semiconductordue to nearby charged. Similar mechanismsoperate insemiconducting nanowires , semiconductingcarbon nanotubes, electrolyte-insulator-semiconductorstructures, suspended gate thin film transistors,and light-addressable potentiometric sensors. Thesefield-effect sensors rely on the interaction of externalcharges with carriers in a nearby semiconductor and thusexhibit enhanced sensitivity at low ionic strength wherecounter ion shielding is reducedand evidenced by the low salt concentrationsoften used. Even though the response of fieldeffectsensors can be characterized by channel conductanceor capacitance of the electrolyte-insulator-semiconductorinterface.
Impedance Biosensor • Impedance biosensors can detect a variety of targetanalytesby simply varying the probe used.Here we focus on- • Detectionof DNA and proteins
Why Study Impedance Biosensors? • Low cost, small instrument size, and speed of analysis are crucial, but cutting-edge accuracy and detection limits are not • Point-of-care diagnostics – a measurement and diagnosis at a bedside, in an ambulance,orduring a clinic visit – are a promising application • Other applications include biowarfareagent detection, consumer test kits, bioprocess monitoring, and water quality testing • Another potential application is the label-free determination of biomolecular affinity coefficients, in which pure target samples are used. In short, impedance biosensors have potential for simple, rapid, label-free, low-cost detection of biomolecules.
To Label or Not to Label? • The major motivation for studying impedance biosensors is their ability to perform label-free detection • An indirect labeling scheme often referred to as a sandwich assay is commonly used for protein detection • This requires two probes that bind to different regions of the target, yielding enhanced selectivity but increasing development costs and limiting use in research settings • The first probe is immobilized on the solid support, the analyte is introduced, and then a secondary probe is introduced after washing • This second probe is labeled or can be detected by introducing yet another labeled probe that binds to all the secondary probes • The widespread ELISA (Enzyme-Linked ImmunoSorbentAssay) technique is the canonical example of a sandwich assay
Label-Free Operation • When a target biomolecule interacts with a probe-functionalized surface, changes in the electrical properties of the surface (e.g., dielectric constant, resistance) can result solely from the presence of the target molecule • No label is required for impedance sensing; this is particularly advantageous for protein detection • some impedance biosensors in the literature use a label. However, labeling requires extra time, expense, and sample handling • Besides the time and expense benefits of omitting the labelingstep, label-free operation enables detection of target-probe binding in real time,which is generally not possible with label-based systems • Real-time sensing confers at least twomajor advantages over endpoint detection. First, time averaging of binding/unbinding events can improve measurement accuracy. Second, it allows determination of affinity constants by curve-fitting the sensor output vs. time
Affinity Biosensor Concepts • Affinity Biosensor = Affinity + Sensor • Probe-Target Binding • Selectivity • Limit of Detection and Reproducibility • Dynamic Range • Amplification • Multiplexing • What Really Limits Biosensor Performance?
Affinity Biosensor Concepts • Affinity Biosensor = Affinity + Sensor Affinity-based biosensors divide the problem of detecting aparticularbiomolecule into two parts: • binding thedesired target while excluding nontarget binding (we callthis the affinity step) and (2) detecting a change in thesurface properties (the readout step)
Affinity Biosensor Concepts (B) Probe-Target Binding • Affinity biosensors are based on a probe binding a targetand can thus be treated in terms of receptor-ligandbindingtheory • The fraction of probe bound atequilibrium (q) is determined by the relative values of thedissociation constant Kd and target concentration: • This is one form of the Langmuir adsorption isotherm, whichdescribes surface binding for identical noninteractingbindingsites. Affinity-based biosensors divide the problem of detecting aparticularbiomoleculeinto two parts: • binding thedesired target while excluding nontarget binding (we callthis the affinity step) and (2) detecting a change in thesurface properties (the readout step)
Affinity Biosensor Concepts (C) Selectivity • Selectivitymeans that the sensor responds only to the targetanalyteand not to other similar molecules. • Generally label-free biosensors cannot distinguish betweenspecific and nonspecific interactions except by probeselectivity, regardless of the readout method. • Selectivity is especially important in real-world sampleswhere the target concentration can be much less than theconcentration of nontargetbiomoleculespresent. • A closely related concept is nonspecific binding, in whichnontargetbiomoleculesstick to the probe layer, preventingtarget binding or causing a false positive signal. • To alleviatethis problem, the sensor chamber is often preexposed to asolution containing a blocking agent such as bovine serumalbumin (BSA) or salmon sperm DNA which nonspecificallyadsorbs (hopefully not occupying the probe bindingsites), reducing subsequent nonspecific binding from theactual sample. • Antifouling agents such as polyethyleneglycol can also be deposited on areas surrounding the sensorto prevent target depletion via nonspecific binding • Use of blocking agents is not a systematic science, butseveral approaches have been found to work in specificsituations • Washingthe sensor surface before readout can sometimes improveselectivity by washing away nonspecifically adsorbed moleculeswhile leaving the target intact, but this in an endpointmeasurement and not real-time approach. • In a homogeneousassay this washing step is not necessary
Affinity Biosensor Concepts (D) Limitof Detection and Reproducibility • Themost cited figure of merit for any chemical sensor is thelimit of detection, or the smallest amount of target that canbe reliably detected • Occasionally the term sensitivity isused, which can also refer to the slope of the response curve • The detection limit can be determinedby measuring the sensor response to a dilution series anddetermining the target smallest concentration at which thesensor response is clearly distinguishable from the responseto a blank solution • Other investigators calculate a limit ofdetection based on the slope of the dose-response curve andthe standard deviation of the blank response according towithout actually demonstrating reproducible detectionat the reported concentration • Detection limits are almost always determined in theabsence of confounding nontargetbiomolecules • To demonstrate clinicalutility, biosensors should be challenged with mixed • target/nontarget samples to simultaneously test selectivityand sensitivity • Real-time readout may improve theachievable detection limit by monitoring the transientsensor response, allowing the binding signal to be separatedfrom the slower nonspecific adsorption signal and drift in thereadout electronics
Affinity Biosensor Concepts (E) Dynamic Range • The dynamic rangeis the ratio of the largest measurable target concentrationand the limit of detection • The upper limit is almost invariablyset by the saturation of the probe with target molecules (θ=1), and thus is determined by the affinity step • Dynamicrange can be extended on the upper end by simply performingmeasurements with dilution series of the sample. Realtimemeasurements also can enhance dynamic range • The smallest detectable change in target concentration isthe resolution (defined as output uncertainly, due to bothsystematic and irreducible noise, divided by the slope of theresponse curve)
Affinity Biosensor Concepts (F) Amplification • All chemical amplification schemes for electrical biosensors rely on either target labeling(including sandwich approach) or cycling of a redox species • Thus amplification techniques lay outside the domain of label-free impedance biosensors (G) Multiplexing • Multiplexing is desirable because itreduces both cost and sample volume per data point • Because electrical signals are readily steered, it is possible todetect various analytes using a single readout circuit • Regardless of readout mechanism, multiplexed proteindetection is complicated by cross-reactivities – a probe bindsto multiple targets or vice versa – which severely limits thepossible degree of multiplexing and is especially troublesomein real-world situations • However, a panel ofseveral biomarker measurements has far more diagnosticpower than a single biomarker can provide
Affinity Biosensor Concepts (H) What Really Limits Biosensor Performance? • It is apparent that the limits of label-free affinity biosensorperformance are more often set by the affinity step than thereadout step • This suggests the need for further researchefforts in probe immobilization chemistries and minimizationof nonspecific binding, while recognizing the fundamentallimits of finite probe affinity, selectivity, and sensitivity
Measuring Electrochemical Impedance • Apply a Voltage, Measure a Current • Electrodes • Instrumentation • Faradaic vs. Nonfaradaic • Data Fitting • Circuit Models • Constant Phase Element • Double Layer Capacitance • Scaling Electrode Size
Measuring Electrochemical Impedance • Apply a Voltage, Measure a Current • Electrical impedance is defined as the ratio of an incrementalchange in voltage to the resulting change in current • Either an AC test voltage or AC test current is imposedwhile the other variable is measured • Mathematically, if theapplied voltage is and the resultingcurrent is then the complexvaluedimpedance Z(w)has magnitudeVAC/IAC and phase θ • The electrode-solution impedance depends on both the biasconditions (VDC) and the measurement frequency (w).
Measuring Electrochemical Impedance • Apply a Voltage, Measure a Current • In impedance biosensors, the applied voltage should bequite small –usually 10mV amplitude or less – for severalreasons- • First, the current-voltage relationship is often linearonly for small perturbations, and only in this situation isimpedance strictly defined • A second reason is to avoiddisturbing the probe layer; covalent bond energies are onthe order of 1 – 3 eV but probe-target binding energies canbe much less (and in some cases the probe is not covalentlyattached to the electrode), and applied voltages will apply aforce on charged molecules. This second consideration alsoapplies to DC bias voltages across the electrode-solutioninterface. • Correctly performed, electrochemical impedancespectroscopy does not damage the biomolecular probelayer, an important advantage over voltammetry or amperometrywhere more extreme voltages are applied
Measuring Electrochemical Impedance (B) Electrodes • At minimum two electrodes are needed to measure electrolyte-solution impedance, and usually three are used • Thecurrent is measured at the working electrode and isbiofunctionalized with the probe • In order to establish adesired voltage between the working electrode and solution,electrical contact must be made with the solution using areference electrode and/or counter electrode • A referenceelectrode maintains a fixed, reproducible electrical potentialbetween the metal contact and the solution, allowing aknown voltage to be applied • A simple piece of wire – apseudoreference or quasireference electrode– cansometimes suffice • A counter electrode supplies current tothe solution to maintain the desired electrode-solutionvoltage, usually in electronic feedback with the referenceelectrode monitoring the solution voltage
Measuring Electrochemical Impedance (C) Instrumentation • Apotentiostat imposes a desired command voltage betweenthe solution and working electrode while simultaneouslymeasuring the current flowing between them • The command voltage for impedance sensing is anACexcitation plus an optional DC offset, and the impedance issimply the ratio of the AC voltage to the AC current • EISanalyzers are potentiostats designed especially for measuringAC impedance, and have typical frequency ranges of10MHz – 100kHz • Computer control is ubiquitous for bothpotentiostats and EIS analyzers, and digital post-processingis commonly employed
Measuring Electrochemical Impedance (D) Faradaic vs. Nonfaradaic Faradaic • In electrochemical terminology, afaradaic process is one where charge is transferred acrossan interface • In faradaic EIS a redox species is alternatelyoxidized and reduced by the transfer of an electron to andfrom the metal electrode. Thus, faradaic EIS requires theaddition of a redox-active species and DC bias conditionssuch that it is not depleted Nonfaradaic • However, transient currents can flow withoutcharge transfer in nonfaradaic processes (e.g., charging acapacitor) • In contrast, no additional reagentis required for nonfaradaic impedance spectroscopy, renderingnonfaradaic schemes somewhat more amenable topoint-of-care applications • The term capacitive biosensorusually designates a sensor based on a nonfaradaic scheme
Measuring Electrochemical Impedance Fig. Common circuit models for a) nonfaradaic and b)faradaic interfaces. (D) Data Fitting Fig. Example nonfaradaic and faradaic impedance data inboth Nyquist (a) and magnitude/phase (b) representations, alongwith dominating element. Complex nonlinear least squares (CNLS) fittingisneeded to incorporate both magnitude and phase in thefitting process and is available in several free (e.g., LEVM)and commercial (e.g., ZView, ZSimpWin) software packages.
Measuring Electrochemical Impedance • Nonfaradaic case • The solution resistanceRsol arises from the finite conductance of the ions inbulk solution, and thus is generally not affected by binding • The capacitance between the metal electrode and ions insolution, Csurf,can be modeled as a series combination thesurface modification capacitance and the double layercapacitance • The component due to surfacemodification depends on the thickness and dielectric constantof the probe layer. It can be thought of as a parallelplate capacitor, whose capacitance is given by (D) Circuit Models Fig. Common circuit models for a) nonfaradaic and b)faradaic interfaces. where εr is the relative dielectric constant, Ais the electrodearea, and t is the insulator thickness. The capacitance Csurfisoften modeled by a constant phase elementinstead of a pure capacitance. In parallel with this capacitance there is a resistive pathmodeled byRleak for nonfaradaic sensors. For an idealinsulator or when no redox species is present, Rleakistheoretically infinite.
Measuring Electrochemical Impedance (D) Circuit Models Faradaic Case • In parallel withcapacitance there is a resistive pathmodeled by the seriescombination of Zw and Rct for faradaicsensors. • The Warburg impedance (Zw), only ofphysical significance in faradaic EIS, represents the delayarising from diffusion of the electroactive species to theelectrode • It is only appreciable at low frequencies, isaffected by convection (and thus may be invalid forexperimental time scales), and has a phase shift of 450. • The charge transfer resistance (Rct) is a manifestation of twoeffects: • the energy potential associated with the oxidationor reduction event at the electrode (i.e. the overpotential)along with (2) the energy barrier of the redoxspecies reaching the electrode due to electrostatic repulsionor sterichinderance. The two circuit elements mostcommonlyused as indication of affinity binding are Csurffornonfaradaic biosensors and Rct for faradaic ones.
Measuring Electrochemical Impedance (E) Constant Phase Element • It has long been recognized that the impedance of solidelectrodes usually deviates from purely capacitive behavior;this is empirically modelled as a constant phase element(CPE) • The complex impedance of a CPE is given by where A is analogous to a capacitance, w is thefrequency expressed in rad/s, and 0.5<m<1 (m = 1 correspondsto a capacitor andm = 0.5corresponds to a Warburgelement; m for Csurfmodelling is typically between 0.85 and0.98). • This introduces a sub-900 phase shift, or equivalently afrequency-dependent resistor in addition to a pure capacitor.
Measuring Electrochemical Impedance (F) Double Layer Capacitance • When an electrode is polarized relative to thesolution, itattracts ions of opposite charge. This tendency is counteredby the randomizing thermal motion of the ions, but results ina local buildup of excess ions of opposite charge. • Thus, anyelectric field arising at the electrode or within ionic solutiondecays exponentially because the excess ions screen thefield. • The characteristic length of this decay, or Debyelength, is proportional to the square root of ion concentration(about 1 nm for biological ionic strengths). • Thiseffect creates a capacitance called the double layer capacitanceor diffuse layer capacitance.
Measuring Electrochemical Impedance (E) Scaling Electrode Size What is the optimal electrode size for affinity impedancebiosensors? • Electrode size greatly impacts the actualimpedance measured, and can be chosen so that theinstrument’s frequency range yields as much useful informationas possible • Conversely, the range of measurementfrequencies can be chosen according to what circuit elementone is trying to measure Nonfaradaic Case • Decreasing Csurf(e.g., by reducing the electrode area orincreasinginsulator thickness) increases the capacitiveimpedance, allowing measurement of capacitive behaviorat higher frequencies • For nonfaradaic sensors, decreasingRleak (insualtor thickness decreases i.e. R leak decrease) tightens the circle in the Nyquist representation, shortensthe transition region in the Bode magnitude plot, and makesit difficult to measure Csurf at low frequencies • DecreasingRsol (e.g., by increasing saltconcentration) mainly affects the high-frequency impedanceplateau, and shifts the transition region slightly tohigher frequencies
Measuring Electrochemical Impedance (E) Scaling Electrode Size • If a typicalnonfaradaic system is scaled down in in all dimensions by afactor λ<1, Csurfand Zwwill decrease by λ2 (increasing theimpedance), Rleak and Rctwill increase by λ2,and Rsolwilldecrease by λ • Thus, isomorphically decreasing the celldimensions is expected to shift the impedance curve tohigher frequencies and higher impedances • It also increasesthe range of frequencies over which Csurf dominates, but thetransition frequency between Rleakand Csurfremains unchanged • This simple analysis neglects many second-ordereffects such as electrode shape and nonuniformity of currentflow at the electrode
Practical Issues in Label-free ImpedanceBiosensors • What Causes an Impedance Change? • Response Curve • Differential Measurement • Self-Assembled Monolayers • DNA vs. Protein Biosensors
Practical Issues in Label-free ImpedanceBiosensors • What Causes an Impedance Change? Faradaic Case • A charged surface presents either an attractive orrepulsive force on ionsnear the electrode; because the interaction of thecharged redox species with the charged probe layer cansignificantly impact Rct (the samephenomenon could alsobe observed by a shift in the redox potential). • Thiseffect has been used to rationalize changes in Rctuponbinding of a charged target forSAMs, forDNAsensors, and for protein sensors. • Changes in molecular conformation could also introducea change in impedance, both in Csurf and Rct. • The former wasexploited for a sensor using a protein whose conformationchanged upon binding of heavy metal ions. • Note thatsurface charge is also dependent on pH, temperature, andother factors.
Practical Issues in Label-free ImpedanceBiosensors • What Causes an Impedance Change? Nonfaradaic Case • In nonfaradaic sensors, it is common to rationalizechanges in Csurfas occurring due to displacement of waterand ions from the surface upon target binding. • Bindingshould increase thickness and/or decrease εrof the probelayer (εr2 – 5 for biomolecules versus 80for water), bothdecreasing capacitance and negligible at higher frequency • A typical conceptual explanationincludes three capacitors in series: dielectric layer of theinsulation (SAM or otherwise), dielectric layer of the probelayer, and the double-layer capacitance • To allow measurementof the probe layer capacitance, the insulating layershould be as thin as possible. Imperfect insulation,modeled by Rleakin parallel with the capacitance, can reducethe sensitivity of the measured impedance to the change inCsurf. • Changes in Rleak are occasionally employed as a sensoroutput, as in, and can be independentlyassessed using cyclic voltammetry with a redox couple.
Practical Issues in Label-free ImpedanceBiosensors • What Causes an Impedance Change? Nonfaradaic Case • Dipoles in the SAM headgroup can contribute tomeasured capacitance because dipoles affect the dielectricconstant εr • This observation could partiallyexplain variation in response between otherwise similartargets. • Note that εr is not strictly constant over frequency, asdipoles may be able to react to slow-moving excitation fieldsbut not to higher-frequency ones. • This research area, termeddielectric spectroscopy, has received limited attentionin the biosensing community but tends to beapplied to measuring bulk solutions at high frequencies(>>1 MHz, Csurfnegligible) and is thus quite distinctexperimentally from conventional surface-sensitive impedancebiosensors (<<1 MHz, Csurf important)
Practical Issues in Label-free ImpedanceBiosensors (B) Response Curve • The response curve is the relationship between the sensoroutput variable (e.g., Rct, change in imaginary part of theimpedance at a particular frequency, etc.) and the targetconcentration • For all affinity biosensors, this responsecurve arises from two separate relations- The first corre-sponds to the affinity step (θ([Target]), relating targetsurface coverage to bulk concentration) The secondcorresponds to the readout step (ᐃZ(θ), relating impedancechange to surface coverage) When [Target] >>Kd, θ≈1 andthe impedance response saturates Thus onewould expect the sensor output to be proportional to thetarget concentration in the low-concentration regime
Practical Issues in Label-free ImpedanceBiosensors (C) Differential Measurement • Utilizing a differential measurement scheme can eliminatevariations in the sensor output caused by disturbancesunrelated to the sensed quantity • For example, Rsol and Csurfare affected by salt concentration, pH, and temperature;impedance changes due to uncontrolled changes of thesefactors may swampout the tiny impedance change caused bytarget-probe binding • In complex samples, nonspecificbinding is also expected to give response unrelated totarget concentration
Practical Issues in Label-free ImpedanceBiosensors (D) Self-Assembled Monolayers • Most impedance biosensors utilize self-assembled monolayers(SAMs) to attach probes at the electrode-solutioninterface • The most common types of attachment chemistriesare based on thiols bound to gold surfaces andsiloxanes to oxide surfaces. • Here, we focus on thiolSAMs because they are prevalent in impedance biosensors • The SAM can be formed and the probes subsequentlyimmobilized on top or else the probes themselves can bethiol-modified and formed as a SAM • SAMs withlonger carbon chains form more dense monolayers due to • hydrophobic interactions of the chains • The general rule ofthumb is thatC11 or greater gives packed films butMirksy et al. reportedCsurf drift due to thiol desorption usinga C11 SAM but not for a C16 SAM. • SAMdesorption is one reason why a sensor might have a responseto a blank solution. Boubour reported that over 40hours ofincubation was required to form a tightly-packed SAM, asdetermined by observing purely capacitive behavior at lowfrequencies , but others report 15 – 20hours dependingon SAM composition and as little as 2 hours .
Practical Issues in Label-free ImpedanceBiosensors (E) DNA vs. Protein Biosensors DNA • Using oligonucleotides (most often DNA) as probes andtargets may be somewhat more convenient than usingantibodies or other proteins. Oligonucleotides are readilyavailable in purified form, immobilization chemistry isrelatively mature, and hybridization exhibits relativelyrobust selectivity. • However, it is unclear whether impedanceDNA biosensors have any commercial viability becausevarious detection technologies already exist for DNA (e.g.,DNA microarrays, pyrosequencing, real time polymerasechain reaction), and other technologies are being researched(e.g., voltammetry using redox-labeled DNA). • However, DNA-based sensors can demonstrate proof-ofprinciplefor protein impedance biosensors and elucidateproperties of the electrode/solution interface.
Practical Issues in Label-free ImpedanceBiosensors (E) DNA vs. Protein Biosensors Aptamers • Aptamers are oligonucleotide or peptide sequenceswhich bind selectively to a desired target, including proteins • They are chosen by an in vitro selection processthat identifies a monomer sequence that tightly binds thetarget from a large library of random sequences. • Aptamers are considered promising alternatives to antibodiesfor capture probes because of facile production, wellunderstoodtethering chemistry, and perhaps reduced crossreactivity
Practical Issues in Label-free ImpedanceBiosensors (E) DNA vs. Protein Biosensors Protein • Proteindetection appears to be the more likely real-world applicationof affinity impedance biosensors because (1) labelingproteins is difficult and impedance sensing can be label-freeand (2) difficulties in cross-reactivity and nonspecific bindingseverely impact all protein sensors, allowing lesssensitive readout techniques to be utilized with equaloverall results • Key issues include poor reproducibility, nonspecificbinding, and the complex and highly variable natureof clinical samples
Early Affinity Impedance Biosensors Credit for the first capacitive affinity biosensor is widelygiven to Newman who in 1986 used interdigitatedelectrodes covered by insulation and an antibody probe. The capacitance can be described byEquation C = εε0A/d where, εis the dielectric constant of the medium betweenplates, ε0 =8.85419 pF/m (permittivity of free space), A = the areaof the plates and d the distance between them. Thus, when thereis a change in the dielectric properties in the material between theplates, a change in the capacitance will occur. Two copper conductors (25 μm high and 50 μm wide) werepositioned on a surface of an insulating material, having adistance of 50 μ m between them
Summary of Published Label-Free AffinityImpedance Biosensors • Early Affinity Impedance Biosensors • Potentiostatic Step • Nonfaradaic Studies • Faradaic Studies • Polymer Films • Special Electrode Surfaces • Interdigitated Electrodes • Miniaturization Efforts http://www3.interscience.wiley.com/journal/114263704/abstract
InterdigitatedCapacitiveBiosensor • The measuring principle of these sensors is based on: • Changes in dielectric properties, • Charge distribution, and conductivity change • when an antibody-antigen complex formed on the surface of anelectrode. • The capacitance between the interdigitated electrodes • C = 2 n 0 A/d, • with is the dielectric constant of the medium between the plates, • 0permittivity of free space, • A the area of the electrodes and • d the distance between the two electrodes, n being the number of electrodes
Dielectric measurements • In a complex protein • positive and negative charges • from the ionizable side chains of acidic and basic amino acid present in the protein structure.
Dielectric measurements The simplest molecular dipole consists of a pair of opposite electrical charges with magnitude of +q and –q and separated by r, vector distance. The molecular dipole moment m is given by the equation m=qr protein-analyte complex formation will give rise to an increase in molecular size of a protein-analyte complex. This increase in size of a protein-analyte complex therefore leads to a relatively large permanent dipole moment.
The dielectric constant passed through dieletric dispersion and decreased with frequency. • It was also observed that the dielectric dispersion Δ (= s - ∞)for control is lower than the antigen treated sample. • The changes in the value of Δ were attributed to change in shape and volume of protein molecules is clear from the figure that the values of conductivity increased whichaccompanied by a decrease in the values of dielectric constant.
The response of this capacitive based sensor for CRP-antigen protein was dependent on concentration in a range 25-800 ng/ml of CRP-antigen as well as frequency at a range 50-350 MHz. • The concentration and frequency above 800 ng/ml and 350 MHz, respectively showed no increase in response by this sensor system. • This was possibly because of saturation of antibody binding sites on the sensor surface. • The sensor surface was bio-functionalized with a constant amount of CRP-antibody (100 µg/ml). It is clear that there are limited binding sites on CRP-antibodies and thus the limitation of CRP-antigen binding capacity.