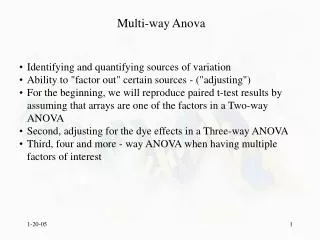
Exploring Popcorn Yield: A Three-Way ANOVA Analysis of Oil Amount, Batch Size, and Type
This example showcases a three-way ANOVA analysis on popcorn yield to understand how factors such as oil amount, batch size, and popcorn type affect the final yield. The provided dataset includes different combinations of oil amounts and batch sizes for plain and gourmet popcorn, allowing for an in-depth examination of interactions between these variables. Key results include statistical significance in interactions, means comparison using Tukey tests, and normality checks of residuals, offering valuable insights into optimal popcorn production variables.


Exploring Popcorn Yield: A Three-Way ANOVA Analysis of Oil Amount, Batch Size, and Type
E N D
Presentation Transcript
Three way ANOVA Example Popcorn!!!
Data Set Popcorn Oil amt. Batch Yield plain little large 8.2 gourmet little large 8.6 plain lots large 10.4 gourmet lots large 9.2 plain little small 9.9 gourmet little small 12.1 plain lots small 10.6 gourmet lots small 18.0 plain little large 8.8 gourmet little large 8.2 plain lots large 8.8 gourmet lots large 9.8 plain little small 10.1 gourmet little small 15.9 plain lots small 7.4 gourmet lots small 16.0
ANOVA Table Source DF Sum of Squares F Ratio Prob> F popcorn 134.81 17.31 0.0032* oil amt 14.41 2.19 0.1768 batch 149.00 24.37 0.0011* batch *popcorn 137.21 18.51 0.0026* batch *oil amt 10.01 0.0050 0.9455 popcorn*oil amt 14.00 1.9900 0.1960 popcorn*oil amt*batch 14.00 1.9900 0.1960
Popcorn Type • Level Least Sq Mean Std Error Mean • gourmet 12.22 0.5012 12.2250 • plain 9.2750000.5012 9.2750
Batch Size • Level Least Sq Mean Std Error Mean • large 9.000000 0.50124844 9.0000 • small 12.500000 0.50124844 12.5000
How to Test Interaction Means Recode Popcorn*Batch as Trt, i.e. Trt=1 is Plain, Small Trt=2 is Plain, Large Trt=3 is Gourmet, Small Trt=4 is Gourmet, Large
New ANOVA Table Source DF SS F Ratio Prob > F Trt 3 121.02000 20.0697 0.0004* oil amt 1 4.41000 2.1940 0.1768 Trt*oil amt 3 8.01000 1.3284 0.3314
Tukey Test of Interaction Means • Level Least Sq Mean • 3 A 15.500000 • 1 B 9.500000 • 2 B 9.050000 • 4 B 8.950000 • Levels not connected by same letter are significantly different.
Test of Normality • Goodness-of-Fit Test • Shapiro-Wilk W Test • W Prob<W • 0.976987 0.9352 • Note: Ho = The data is from the Normal distribution. Small p-values reject Ho.