
Biochemical Assays of ATR, ATM, and mTOR for Cellular Response Studies
Explore the impact of ATR, ATM, and mTOR inhibitors on DNA repair pathways through biochemical assays. Supplementary figures provide experimental insights.

Biochemical Assays of ATR, ATM, and mTOR for Cellular Response Studies
E N D
Presentation Transcript
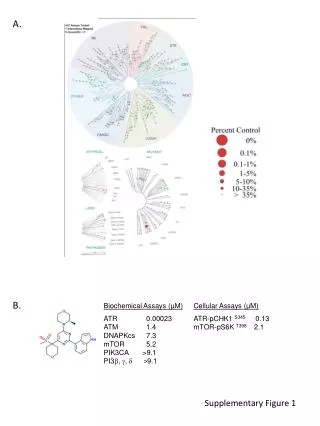
A. B. Biochemical Assays (µM) ATR 0.00023 ATM 1.4 DNAPKcs 7.3 mTOR 5.2 PIK3CA >9.1 PI3b, g, d >9.1 Cellular Assays (µM) ATR-pCHK1 S3450.13 mTOR-pS6K T398 2.1 Supplementary Figure 1
A. mTORi=AZD8055 (-H2AX EC50 (+HU) >10M) DNA-PKcsi=NU7441 (-H2AX EC50 (+HU) >10M) B. ATRi/mTORi (-H2AXEC50 (+HU)=7M) ATMi=KU55933 (-H2AX EC50 (+HU)>10M) C. D. Supplementary Figure 2
A. untreated (0.4%) 1 µM ATRi (2.3%) B. 1 µM gemcitabine + 1 µM ATRi (58.7%) 1 µM gemcitabine (2.2%) H2AX-FITC PI C. 1 µM cytarabine + 1 µM ATRi (42.0%) 1 µM cytarabine (0.6%) 1 µM clofarabine + 1 µM ATRi (47%) D. 1 µM clofarabine (6.4%) E. 5 µM cladribine + 1 µM ATRi (40.4%) 5 µM cladribine (7.3%) Supplementary Figure 3
A. ATRi 2 h ATRi 24 h B. DMSO 0.5 µM 1.0 µM DMSO 0.5 µM 1.0 µM Supplementary Figure 4
B. A. C. D. Supplementary Figure 5


