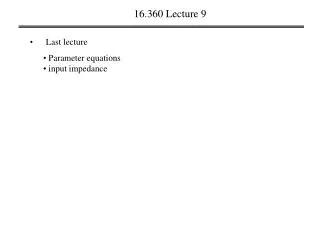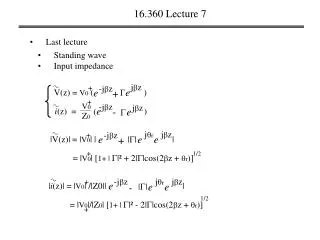
16.360 Lecture 9
16.360 Lecture 9. Normalized admittance. z and y are directly opposite each other on. Smith Chart. 16.360 Lecture 9. Parameter equations. Unit circuit. Short Circuit load. B. Open Circuit load. 16.360 Lecture 9. Normalized impedance. Parameter equations. 16.360 Lecture 9.

16.360 Lecture 9
E N D
Presentation Transcript
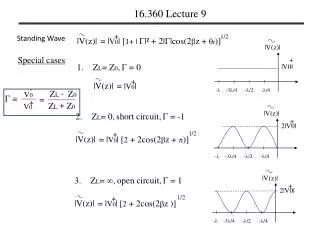
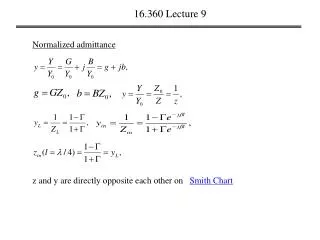
16.360 Lecture 9 Normalized admittance z and y are directly opposite each other on Smith Chart
16.360 Lecture 9 Parameter equations Unit circuit . Short Circuit load B Open Circuit load
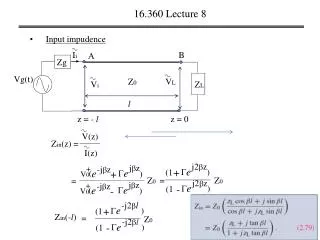
16.360 Lecture 9 Normalized impedance Parameter equations
16.360 Lecture 9 Parameter equations
16.360 Lecture 9 An example Smith Chart Input impedance Wavelength toward generator (WTG) Smith Chart
16.360 Lecture 9 An example find Zin (-0.1) Smith Chart Constant || circle, SWR Circle
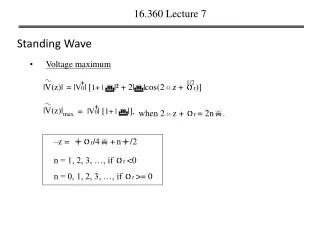
+ + |V(z)| |V(z)| |V0| [1+ | |], |V0| [1 - | |], = = max min 16.360 Lecture 10 SWR, voltage maximum and minimum If Smith Chart Recall: when 2z + r = 2n. when 2z + r = (2n+1).
16.360 Lecture 10 An example A 50- lossless line is terminated in a load ZL = (25+j50). Use the smith chart to find a) voltage reflection coefficient, b) the voltage standing-wave ratio, c) the distances of the first voltage maximum and first voltage minimum from the load, d) the input impedance of the line, given the line is 3.3, and e) the input admittance of the line. Smith Chart
16.360 Lecture 11 • impedance matching A Ii Zg Vg(t) Matching network Z0 ZL Zin Tarnsmission line A’ Zin = Z0
16.360 Lecture 11 • single-stub impedance matching network d M A Ii Zg YL’ Vg(t) Yin Y0 YL ZL Transmission line A’ Yin = Yd’ + Ys’ M’ Ys’ 1 = Yin l 1= Yd’ + Ys’ Ys Yd’ + Ys’ = 1
16.360 Lecture 11 d M A Ii Yin = Yd’ + Ys’ Zg 1 = Yin YL’ Vg(t) Yin Y0 YL ZL 1= Yd’ + Ys’ Transmission line Yd’ A’ M’ + Ys’ Ys’ l = 1 Im Re Ys Yd’ + Ys’ =
16.360 Lecture 11 • single-stub impedance matching network d M A Ii Zg Vg(t) Yin Y0 ZL Yd Transmission line A’ M’ Ys An example l A 50- transmission line is connected to an antenna with in a load ZL = (25-j50). Find the position and the length of the short-circuited stub required to match the line. Smith Chart
ZL A’ 16.360 Lecture 12 • Transient on transmission line Ii A Zg Vg(t) Z0 Tarnsmission line If 1, 2,…, n are transmitted on the transmission line at the same time, each frequency has its own location of voltage distribution. The total voltage V(z) is the sum of all these Vi(z).
16.360 Lecture 12 Step function and pulse function • step function U(t) U(t) = 1, if t>=0; U(t) = 0, if t<0 • single pulse function V(t) V(t) = U(t) – U(t-t0),
ZL + A’ = LV1 - V1 + - - + V1 V1 V2 V2 16.360 Lecture 12 • transient of a step function A Zg Vg(t) Ii Z0 Tarnsmission line - + + = gV1 V2 V1 - - + + gV1 V2 = LV2 LV1 + + + + … V =
- + = gV1 V2 + - + V1 V2 = LV2 - + gV1 LV1 + = LV1 - V1 16.360 Lecture 12
16.360 Lecture 12 • Bounce Diagram = g = L T 2T 3T 4T 5T
16.360 Lecture 12 • An example Z0 = 75, r = 2.1, Vg = ?, Zlf = ?, Lf = ? V 6V 3V t 12s