Chapter 5 Normal Probability Distribution
Chapter 5 Normal Probability Distribution. GOALS List the characteristics of the normal probability distribution. Define and calculate z values . Determine the probability an observation will lie between two points using the standard normal distribution.

Chapter 5 Normal Probability Distribution
E N D
Presentation Transcript
Chapter 5Normal Probability Distribution • GOALS • List the characteristics of the normal probability distribution. • Define and calculate z values. • Determine the probability an observation will lie between two points using the standard normal distribution.
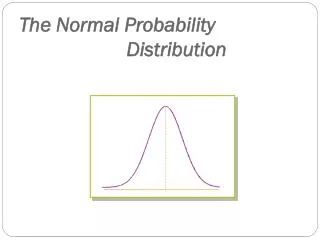
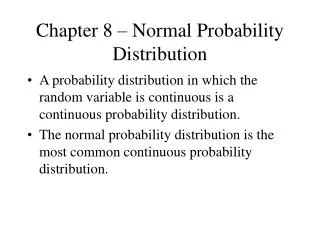
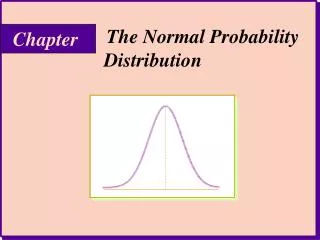
CharacteristicsNormal Probability Distribution • The normal curve is bell-shaped and has a single peak at the exact center of the distribution. • The arithmetic mean, median, and mode of the distribution are equal and locatedat thepeak. • Thus half the area under the curve is above the mean and half is below it.
Characteristics Normal Probability Distribution • The normal probability distribution is symmetrical about its mean. • The normal probability distribution is asymptotic. • That is the curve gets closer and closer to the X-axis but never actually touches it
Characteristics Normal curve is symmetrical Theoretically, curve extends to infinity Mean, median, and mode are equal
The Standard Normal PD • The standard normal (or z) distribution is a normal distribution • Mean of 0; standard deviation of 1 • A z-value is the distance between a selected value, designated X, and the population mean µ, divided by the population standard deviation, σ.
Standard Normal - Example • The bi-monthly starting salaries of recent MBA graduates follows the normal distribution with a mean of $2,000 and a standard deviation of $200.
Standard Normal - Example • Mean $2000 / SD $200… • What is the z-value for a salary of $2,200? • What is the z-value of $1,700?
Areas Under the Normal Curve • +/- … • 1 Standard Deviation: About 68 % • 2 Standard Deviations: About 95% • Practically all (99.7%) is within three • Applications • Estimates of population ranges/description • Translates to “probability”
Area - Example • The daily water usage per person in New Providence, New Jersey is normally distributed with a mean of 20 gallons and a standard deviation of 5 gallons. • About 68 percent of those living in New Providence will use how many gallons of water?
Area - Example • What is the probability that a person from New Providence selected at random will use between 20 and 24 gallons per day? • Translate to “z value” • Use the book (or Excel) to determine the area under the curve… “the probability”
Area - Example • The area under a normal curve between a z-value of 0 and a z-value of 0.80 is 0.2881. • We conclude that 28.81 percent of the residents use between 20 and 24 gallons of water per day.
-4 -3 -2 -1 0 1 2 3 4 x Area - Example P(0<z<.8) =.2881 0 < x < 0.8
Area - Example • What percent of the population use between 18 and 26 gallons per day?
Area - Example • Area associated with a z-value of – 0.40 is ____ • Remember that the curve is symmetrical! • Area associated with a z-value of 1.20 is ______ • Adding these areas, the result is _______ • We conclude that…
Area - Example • Professor Mann has determined that the scores in his statistics course are approximately normally distributed with a mean of 72 and a standard deviation of 5. He announces to the class that the top 15 percent of the scores will earn an A. • What is the lowest score a student can earn and still receive an A?
Area - Example • To begin let X be the score that separates an A from a B. • If 15 percent of the students score more than X, then 35 percent must score between the mean of 72 and X. • The z-value associated corresponding to 35 percent is about _______.
Area - Example • We let z equal 1.04 and solve the standard normal equation for X. • The result is the score that separates students that earned an A from those that earned a B.
Normal Approximation to the Binomial • The normal distribution (a continuous distribution) yields a good approximation of the binomial distribution (a discrete distribution) for large values of n. • Generally a good approximation to the binomial probability distribution when… • n*p and n*(1 - p) are both greater than 5.
The Normal Approximation continued • Recall for the binomial experiment: • There are only two mutually exclusive outcomes (success or failure) on each trial. • A binomial distribution results from counting the number of successes. • Each trial is independent. • The probability is fixed from trial to trial, and the number of trials n is also fixed.
Continuity Correction Factor • The value .5 subtracted or added, depending on the problem, to a selected value when a binomial probability distribution (a discrete probability distribution) is being approximated by a continuous probability distribution (the normal distribution). • Rules (pg 246)
Approximation - Example • A recent study by a marketing research firm showed that 15% of American households owned a video camera. • For a sample of 200 homes, how many of the homes would you expect to have video cameras?
Approximation - Example • What is the variance? • What is the standard deviation?
Approximation - Example • What is the probability that less than 40 homes in the sample have video cameras? • We use the correction factor… (pg 246) • So X is ________ • The value of z is _______
Approximation - Example • From Appendix D the area between 0 and 1.88 on the z scale is .4699. • So the area to the left of 1.88 is .5000 + .4699 = .9699. • The likelihood that less than 40 of the 200 homes have a video camera is about 97%.
z = 1.88 0 1 2 3 4 P(z < 1.88) = .5000 + .4699 = 0.9699