Calculating Steel Rod Length Probabilities with Normal Distribution
Learn how to calculate probabilities related to the length of steel rods using the normal distribution. Find areas under the curve, discard proportions, and determine percentiles with detailed examples.

Calculating Steel Rod Length Probabilities with Normal Distribution
E N D
Presentation Transcript
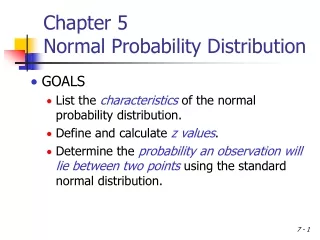
Chapter 7The Normal Probability Distribution 7.3 Applications of the Normal Distribution
EXAMPLE Finding the Area Under a Normal Curve It is known that the length of a certain steel rod is normally distributed with a mean of 100 cm and a standard deviation of 0.45 cm.* What is the probability that a randomly selected steel rod has a length less than 99.2 cm? *Based upon information obtained from Stefan Wilk.
EXAMPLE Finding the Area Under a Normal Curve It is known that the length of a certain steel rod is normally distributed with a mean of 100 cm and a standard deviation of 0.45 cm. What is the probability that a randomly selected steel rod has a length between 99.8 and 100.3 cm?
EXAMPLE Finding the Area Under a Normal Curve It is known that the length of a certain steel rod is normally distributed with a mean of 100 cm and a standard deviation of 0.45 cm. Suppose the manufacturer must discard all rods less than 99.1 cm or longer than 100.9 cm. What proportion of rods must be discarded?
EXAMPLE Finding the Area Under a Normal Curve It is known that the length of a certain steel rod is normally distributed with a mean of 100 cm and a standard deviation of 0.45 cm. Find the length corresponding to the 35th percentile.
EXAMPLE Finding the Area Under a Normal Curve It is known that the length of a certain steel rod is normally distributed with a mean of 100 cm and a standard deviation of 0.45 cm. Suppose the manufacturer wants to accept 90% of all rods manufactured. Determine the length of rods that make up the middle 90% of all steel rods manufactured.