PV Cells, Modules & Array Sizing
PV Cells, Modules & Array Sizing. Cells, Modules, & Arrays. Types of PV Cells/Products. Single Crystalline Polycrystalline String Ribbon Amorphous or Thin Film. PV Materials & Efficiencies. Efficiency. Ratio of power out put to solar power input
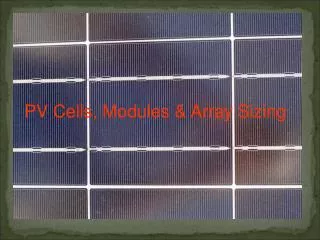

PV Cells, Modules & Array Sizing
E N D
Presentation Transcript
Types of PV Cells/Products Single Crystalline Polycrystalline String Ribbon Amorphous or Thin Film
Efficiency • Ratio of power out put to solar power input • Multiply full sun irradiance (1000 watts/m2) by area of module in m2 and divide into rated power of module in watts • Example • Efficiency = P mp / solar irradiance x area (m2) • What is efficiency of module with a surface area of 1.2 m2 and maximum power output of 160 W when exposed to 1000 w/m2 • 160/(1000 x 1.2) = .133 0r 13.3%
PV Efficiencies (www.wikipedia.com) 1883 - less than 1% efficiency 1954 – AT&T labs marks 6% efficiency. 1955 - 2% efficient commercial solar cell for $25/cell or $1,785/Watt. 1957 - 8% efficient commercial solar cell 1958 - 9% efficient commercial solar cells 1959 - 10% efficient commercial solar cell 1960 - 14% efficient commercial solar cell 1976 - first amorphous silicon PV cells have an efficiency of 1.1% 1980 - thin-film solar cell exceeding 10% efficiency 1985 - 20% efficient silicon cell 1989 - Reflective solar concentrators are first used with solar cells. 1994 - concentrator cell (180 suns) becomes the first solar cell to exceed 30% conversion efficiency 2005 - Solar cells in modules convert around 17% of visible incidental radiant energy
Best Research-Cell Efficiencies Spectrolab Multijunction ConcentratorsThree-junction (2-terminal, monolithic)Two-junction (2-terminal, monolithic) Crystalline Si CellsSingle crystalMulticrystallineThin Si Thin Film TechnologiesCu(In,Ga)Se2CdTeAmorphous Si:H (stabilized) Emerging PVOrganic cells 36 Spectrolab Japan Energy 32 NREL/ Spectrolab NREL 28 NREL UNSW UNSW 24 UNSW Spire UNSW NREL Cu(In,Ga)Se2 14x concentration UNSW Stanford Spire UNSW Georgia Tech ARCO 20 NREL Efficiency (%) Sharp Georgia Tech Westing- house Varian NREL NREL NREL 16 UniversitySo. Florida NREL No. Carolina StateUniversity NREL AstroPower Euro-CIS Boeing Solarex ARCO Boeing 12 Kodak Boeing UnitedSolar AMETEK Masushita United Solar AstroPower Kodak Boeing 8 Monosolar Photon Energy RCA Solarex University California Berkeley Boeing Princeton University of Maine 4 RCA RCA UniversityKonstanz RCA RCA RCA NREL RCA 0 1975 1980 1985 1990 1995 2000 026587136
Silicon Cell Voltage .5 - .6 volts/cell Not related to size Voltage affected by temperature Open circuit voltage Maximum power voltage For Sharp 80 watt (36 cells) Voc = 21.6/36 = .6 Voc/cell
Temperature Response • High temperatures significantly reduces voltage & power • High temperatures slightly increases amperage (often ignored) • Low temperatures significantly increase voltage & power • Low temperatures slightly decrease amperage (often ignored) • Focus is on internal cell temperatures at the P-N junction not ambient temperatures typically • Cell temperature influenced by ambient temperature, wind speed, solar irradiance, thermal characteristics of module and installation method • Cell temperatures of 25C (77F) over ambient are typical for most arrays at peak sun (1000 w/m2)
Calculating maximum voltage and maximum string size • Example: How many modules, each having a Voc of 36.5 V can be placed in a series string without exceeding the 600 volt limit of a grid tie inverter when the record low temperature is -30 C? • Voc = 36.5 volts x 1.25 = 45.62 Voc • 600 volt inverter/45.62= 13 modules
Using Temperature Coefficients • Temperature Coefficients are the rate of change in voltage, current, or power output due to increasing cell temperature • Negative coefficient means parameter (ie: voltage & power) decreases with increasing cell temperature or increases with decreasing cell temperature • Positive coefficient means parameter (ie: amperage) increases with increasing cell temperature • Can be expressed as unit change or percentage change (typically uses 25C (77F) as reference • Typical unit change values are -2.25 mV/C • Typical percentage change coefficients • -0.45%/C for voltage • + 0.10%/C for current • -0.50%/C for power Weather data: http://www.weather.com/weather/climatology
Open Circuit Voltage Temperature Coefficient(% change per degree C) • Example • How many Sharp 216 watt modules, each having a Voc of 36.5 V and temperature coefficient of -0.36%/C, can be placed in a series string without exceeding the 600 volt limit of a grid tie inverter when the record low temperature is -20 C? • -0.36%/C = .36/100 = .0036 • .0036 x 36.5 V = .13 V/C • Delta T = -20 – 25 = 45 C • .13 V/C x 45 = 5.85 volts • 36.5 Voc + 5.85 volts = 42.35 Volts • 600 V/42.35= 14 modules
Factors Affecting Current Production Related to size of cell .2 amps/square inch or .03 amps (30 milliamps) per square centimeter Affected by irradiance primarily Short Circuit Current Used to determine maximum current Isc X 1.56 to estimate maximum current for wire sizing Maximum Power Current
Photovoltaic Device IV Curve at STC(25 C (77 F) and 100 watts/m2)
PV Modules Many sizes and types available (5 – 310 watts) Global market growing by more than 50%/year Efficiencies 6 – 21% Watts/SF: 5.6 – 19.6 Cells in series: 36 - 144 25 year warranties $1 -2/watt
Aluminum Low Iron Tempered EVA (Ethylene vinyl acetate) Or PVB (polyvinyl butiral Tedlar
Estimating The Annual Energy Output (AEO) of a PV System • Basic Conservative Rule of Thumb: For every KW installed one can expect 1000 KWH/year in electrical energy production • Example: 5 KW system will produce 5,000 KWH/year • More detailed approach: • Array size x average sun hours per day x 365 x efficiency of BOS components • Example: How much energy per year can be expected from a PV system with 25 – 200 watt panels installed in an area with an average of 4.5 hours of full sun per day and having a BOS efficiency of 65% • 25 x 200 x 4.5 x 365 x .65/1000 = 5,338 KWH/year
Area needed for each KW • Basic Guideline: 100 SF/kw or 9 m2/kw • How many SF of roof area would be required for a 5 KW array? • 5 KW x 100 = 500 SF • 5 KW x 9 m2 = 45 m2 (1 m2 = 10.7639 SF ; 1 SF = .092903 m2) • Another approach from Chapter 3 • Area = array power/module efficiency • Example: How many m2 of roof area would be required for a 5 KW array composed of 12% efficient modules • Area (m2) = 5 KW/.12 = 41.6 m2 or 448 SF + 10% = 492 SF
Standard Test Conditions (STC) 1000 w/m2 & cell temp of 25 C (77F) Standard Operating Conditions (SOC) 1000 w/m2 & nominal operating cell temperature (NOCT) Nominal Operating Cell Temperature (NOCT) temperature of open circuit module based on 800 w/m2 , ambient temp of 20 C (68F) and wind speed of 1 m/s (varies by module) Nominal Operating Conditions (NOC) 800 w/m2 & NOCT PVUSA Test Conditions (PTC) 1000 w/m2 ; ambient air temperature of 20C (68F); and wind speed of 1 m/s Test Conditions
Additional Module Specifications • Series Fuse Rating • Current rating of a series fuse used to protect module from overcurrent under fault condition (7 – 20 amps) • Connector Type • Module output terminal or Junction box (J boxes) or cable/connector configuration (weather tight connectors: Solarloc or MC/MC4) • Lockable connectors required (solarloc or MC4) • J –boxes & conduit required in readily accessible locations