Life Cycle Report
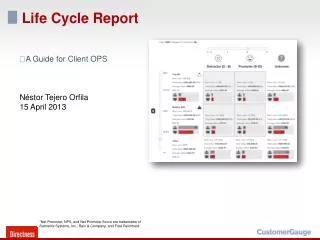
Life Cycle Report. A Guide for Client OPS Néstor Tejero Orfila 15 April 2013. *Net Promoter, NPS, and Net Promoter Score are trademarks of Satmetrix Systems, Inc., Bain & Company, and Fred Reichheld . Life Cycle - basics. Life Cycle has three main sections:

Life Cycle Report
E N D
Presentation Transcript
Life Cycle Report • A Guide for Client OPS • NéstorTejeroOrfila15 April 2013 *Net Promoter, NPS, and Net Promoter Score are trademarks of Satmetrix Systems, Inc., Bain & Company, and Fred Reichheld.
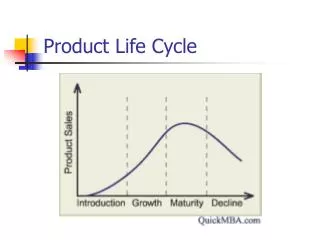
Life Cycle - basics • Life Cycle has three main sections: • Value and loyalty: promoters and detractors. • Value and loyalty 6 box: promoters, passives and detractors. • Climbers / Fallers: score growing or decreasing. • From all of them a list of users can be shown and therefore extracted. • Then, each customer has an specific page with his/her purchases, comments and scores.
Life Cycle - basics • Information is based on rand_value field, stored in tables cgnpsdata_awaiting & cgnpsdata_completed. • It is converted to euros and stored in rand_value_converted. This conversion is based on currency field, which refers to the indexes in cglookup_currency. • In case there is no rand_value defined (it's 0 for all purchases), it can be set to 10. This way Life Cycle calculations can be done even though we do not have this value.
Life Cycle - basics • Data is calculated every night automatically and summaries are saved in the database. • This way information can be accessed at high speed throughout several filters: • years • quarter • countries, • percentages. • Every night, current quarter data is calculated. • Once a month all data is re-calculated. • Last calculation can be checked in the header:
Life Cycle has three main sections: • Value and loyalty Life Cycle – Value and Loyalty • Show users as promoters (score 0 up to X) or detractors (score X+1 up to 10). Select limit (X). Default setting: 0-8 | 9-10 • Slide to select the percentage to split between top and bottom. • Summary tables at the bottom. Default setting: 8%
Life Cycle – Value and Loyalty Slider to change limit promoter / detractor Customers withno scoring Slider to change percentage Total values
Life Cycle – Value and Loyalty (6 box) • Similar to Value and Loyalty, but using the CLASSIC NPS approach, here having “passives”.
Life Cycle – Climbers and fallers • Distinguish how many users improve/maintain/decrease their score.
Life Cycle – Summary tables • Customer number • Show NPS and response rate. • Response rate = (responses / total customers). • Summarize number of users on each block. • Data updated while moving sliders.
Life Cycle – List of users • List of users belonging to specific block.
Life Cycle – List of users Last score Link to Customer Page Revenue on filtered period Total revenue First and last lifetime order of this customer
Flow of Drill Down Show details for transaction and NPS survey (L1/L2) See customers by segment List customers in that segment Drill down to customer, show transaction history and NPS score
Life Cycle - Customer Page • Summary of purchases: lifetime and last 12 months. • Two charts: • Score of surveys completed. • Value of purchases. • Lists all purchases with comments if given, ordered by date of order. • The NPS chart shows score in grey. From that score up to 10 in red. • If no NPS, there is no column. • Hence, • 10 –> grey column • 0 –> red column • empty space –> no score
Life Cycle - Summary • Data updated every night. • Value converted to euros automatically • We use historic currency table (values for each month). • Filters. • Sliders to change values. • Focus on “top”: detractors, promoters, unknown. • Magic Pareto: 8% of customers → 40% revenue.
Life Cycle - Limitations ! • NOTE! • As at 15 April release, only one common currency is possible: EURO • All values are converted to EUR • We plan a release in MAY 2013 enabling other currencies
Life Cycle – Calculation • Compare last and previous NPS (truth table). • This table shows how we mark the position in the 6 box table, and in the climber/faller table • It is based on looking at transaction history – we show the 1st to 5th transactions here as examples, (5th is the most recent)