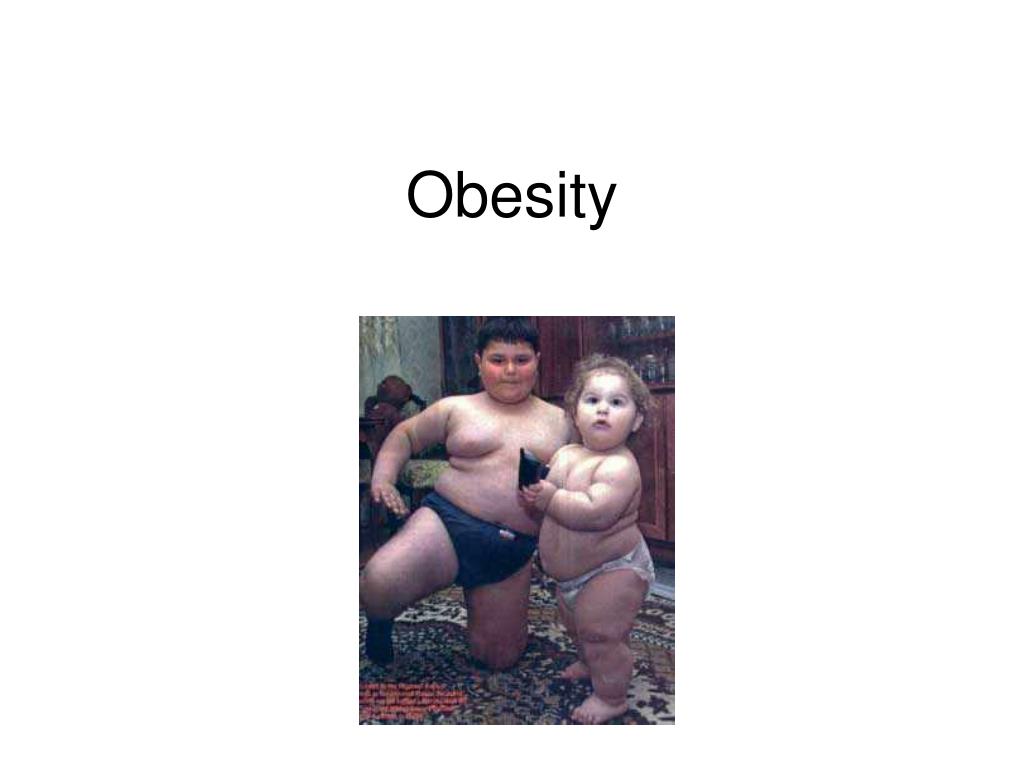
Obesity
Body Mass Index
Definition-CDC Adults BMI Weight Status Below 18.5 Underweight 18.5 – 24.9 Normal 25.0 – 29.9 Overweight 30.0 and Above Obese
CDC-children/teens* BMI-for-age Weight status < 5th %Underweight 5th % to < 85th % Normal 85th % to < 95th % at risk of overweight > 95th %Overweight *Gender and age specific
TABLE: Prevalence of Obesity* Among Children and Adolescents: 1960-2000 *obesity defined as 95th percentile of BMI for a specific age group
Obesity • Pediatric Epidemic Past 20 years - doubled in kids/adults; tripled in teens 1999-2002 – age 6-19 years old - 31% at risk for overweight (BMI 85-95%); 16% overweight (BMI over 95%) http://www.aap.org/catch/WS 132 - Gombosi FINAL.ppt- 6013.0KB- AAP Sites
1,430 patient records ages of two and 18 50% in pediatric gastroenterology clinics, 32% were seen in PCP office, 18% pediatric endocrinology 29% of patients were overweight or obese 6% of the children (n=86) had a BMI in the 85th-89th percentile (0%) 6% (n=86) in the 90th-94th percentile (6%) 17% (n=243) in the 95th percentile. (39%) Of the patients seen by pediatric gastroenterologists: NONE of those with a BMI between the 85th-89th percentile were diagnosed as being overweight, only 6% of those with a BMI between the 90th and 94th percentiles were diagnosed as overweight, and 39% of those with a BMI 95th percentile received a diagnosis of obesity. Nutritional counseling: Pediatric gastroenterologists -44% Pediatric endocrinologists- 84% General pediatricians-81% (P<0.05). Matthew Riley, MD, Pediatric Gastroenterology, Stanford University, Palo Alto, Calif.
NASPGHAN Position Paper
NAFLD • Reported prevalence in obese children is 10-25% • Spectrum of disease hepatic steatosis to progressive necroinflammatory/fibrotic damage
NAFLD • Incr fat deposition in hepatocyte due to incr hepatic delivery of FFAs • Insulin resistance impairs suppression of lipolysis • Excessive fa oxidation generates free radicals damaging hepatocytes and inducing fibrogenesis via cytokine production J Pediatr 2005;147:62-6.
Fatty inflammation • IL-6 produced by adipocytes induces C-reactive protein thus obesity is associated with low-grade systemic inflammation Pediatrics 2001,107:e13
Therapy • UDCA • Lipid lowering agents-clofibrate, gemfibrozil-+/- • Statins-? • Lecithin,B-carotene,selenium-no RCT • Vitamin E, betaine(precursor to S-AM)? • OLT
Therapy • Insulin resistance-most reproducible predisposing factor for NAFLD Insulin-sensitizers-thiazolidinediones Improve NAFLD but pulled due to hepatic injury • Metformin-increase hepatic insulin sensitivity-experimental
Bariatric Surgery • Malabsorptive procedures-no longer performed (intestinal bypass) • Gastric bypass- “gold-standard” • Vertical banded gastroplasty • Adjustable gastric banding • Implantable gastric stimulation
Adjustable gastric banding
Implantable gastric stimulation
Gastric bypass
Vertical banded gastroplasty
Criteria • Prescriptive diet 6 months • Counseling • Obstructive sleep apnea • BMI >X
Who’s Most at Risk &Associated Conditions • Risk Factors • Genetic, environmental, sociocultural, biological, psychological • Everyone at risk • Entire population, every state BUT low SES • Either parent overweight • Smaller families • Avid TV and low family physical activity • High fast foods and soda consumption http://www.aap.org/catch/WS 132 - Gombosi FINAL.ppt- 6013.0KB- AAP Sites
Who’s Most at Risk & Associated Conditions • Related medical and non-medical problems • 60% overweight children have at least 1 current cardiovascular risk factor (high blood pressure, lipids, type 2 diabetes) and 20% have 2 or more risk factors • 30% new onset child diabetes is type 2 • 75% overweight children with significant behavioral health problems http://www.aap.org/catch/WS 132 - Gombosi FINAL.ppt- 6013.0KB- AAP Sites
Who’s at Risk & Associated Conditions • Causes • 15% increase in avg calorie consumption over past 15 years = 300 cal/day = 30 lbs/yr) • Prime Industrial Causes – food producers, corn fructose subsidies; fast food calories/portion size; ads to children; tv/sedentary lives and schools/cars • TV science – lowest prevalence 1 or less hrs/day; highest prevalence over 4 hrs/day • Soda science – risk increases 1.6 times for each extra can of soda or fruit juice/day http://www.aap.org/catch/WS 132 - Gombosi FINAL.ppt- 6013.0KB- AAP Sites
Therapy