Download
1 / 16
160 likes | 177 Vues
Learn about phenomena on various scales, connections within the Earth system, and cycles of energy, water, and chemicals. Discover GLOBE measurements and protocols for studying the Earth.

E N D
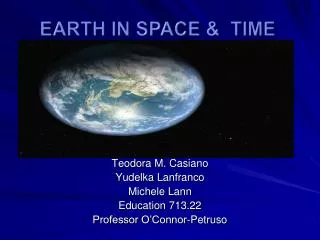
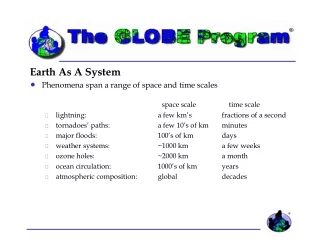
Earth As A System • Phenomena span a range of space and time scales space scale time scale • lightning: a few km’s fractions of a second • tornadoes’ paths: a few 10’s of km minutes • major floods: 100’s of km days • weather systems: ~1000 km a few weeks • ozone holes: ~2000 km a month • ocean circulation: 1000’s of km years • atmospheric composition: global decades
Earth System Connections • Phenomena on all scales are connected together • some volcanic eruptions alter the atmosphere globally for years • El Nino in the tropical Pacific affects weather for months, even in the United States • passage of a weather system can spawn tornadoes which cut a swath through a forest triggering the process of forest succession • These and other connections are fundamental to the Earth system.
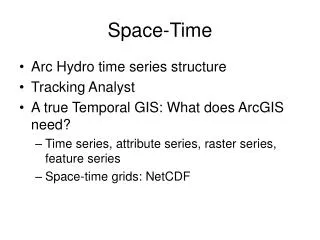
Earth System Cycles • The cycling of energy, water, and certain chemical elements ties the system together • Energy from the Sun enters the top of the atmosphere; some is reflected back to space while the rest powers the Earth system • Water evaporates from the surface, condenses or freezes, falls back to the surface, runs-off or sinks into the soil, flows to aquifers, rivers, the oceans • The chemical elements C, N, P, and S cycle among living organisms, the atmosphere, sediments, soils, and water bodies
Earth System Measurements in GLOBE • GLOBE students measure components of the Earth system and its cycles • Energy: temperatures of air, water, and soil; clouds; transparency • Water: precipitation; soil moisture, infiltration, and bulk density; land cover • Biogeochemicals: pH of precipitation, water, and soil; soil characterization; water chemistry; land cover and biology
Categories of Measurement Protocols • Basic • Advanced • Optional • Special
Basic Protocols • Soil • Field Characterization • Bulk Density • pH • Temperature • Gravimetric Moisture • Land Cover • MUC • Qualitative Land Cover Sampling • Quantitative Land Cover Sampling • Manual Mapping • Atmosphere • Cloud • Temperature • Precipitation • Hydrology • Transparency • Temperature • pH • Conductivity • Salinity • Phenology • Green-Up • Green-down
Advanced Protocols • Hydrology • Dissolved Oxygen • Alkalinity • Nitrate • Soil • Soil Fertility • Particle Size Distribution • Particle Density (under development) • Land Cover • Computer Assisted Clustering • Accuracy Assessment
Optional Protocols • Hydrology • Salinity Titration • Marine Macroinvertebrates (under development) • Freshwater Macroinvertebrates (under development) • Soil • Infiltration • Soil Moisture Sensor • Other • Automated Soil and Air Temperature Monitoring (under development)
Special Protocols • Phenology • Budburst • Lilacs • Snow Pack Water Equivalent • Fire Ecology (under development)
“GLOBE Study Site” 15 km x 15 km The “GLOBE Study Site, 15 x 15 km (512 x 512 pixels) centered on the school, contains the various study sites for atmosphere, soils, hydrology and biometry/land cover. Schools may select measurement sites outside of this 15 x 15 km areas, and separate imaging can be provided. Hydrology Site Soil Characterization Biology Site School Soil Moisture Site Atmosphere Site Qual/Quan Land Cover Sites
March Normalized Difference Vegetation Index, 1987 May
Solar Energy April 1987 Average Temperature
Cloud Cover September 1987 Precipitation