Download
1 / 8
80 likes | 177 Vues
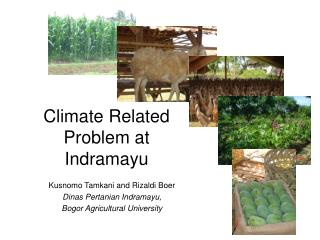
CLIMATE EXTREMES AND RELATED STATISTICS MEASURED AT CLIMATE REFERENCE NETWORK STATIONS. Measured Air Temperature Ground Surface Temperature Measured Precipitation. Climate Reference Network Temperature Extremes (°F), 2002-2007. Highest Air Temperature = 125°F

E N D
CLIMATE EXTREMES AND RELATED STATISTICSMEASURED AT CLIMATE REFERENCE NETWORK STATIONS Measured Air Temperature Ground Surface Temperature Measured Precipitation
Climate Reference NetworkTemperature Extremes (°F), 2002-2007 • Highest Air Temperature = 125°F Death Valley, California July 18, 2005 • Lowest Air Temperature = - 56°F Barrow, Alaska February 3, 2006 • Highest Ground Surface Temperature = 149°F Death Valley, California July 17, 2005 • Lowest Ground Surface Temperature = - 58°F Barrow, Alaska February 3, 2006
Consecutive Days With Maximum Temperatures ≥ Various Thresholds At Death Valley, California ≥120°F = 11 DaysJuly 12 -22, 2005 ≥110°F = 25 DaysJune 29 - Jul. 23, 2005 ≥100°F = 82 DaysJune 19 - Sep. 8, 2005 ≥ 95°F = 95 DaysJune 8 - Sep. 10, 2005 ≥ 90°F = 132 DaysMay 12 - Sep. 20, 2005
Consecutive Days With Minimum Temperatures ≥ Various Thresholds At Barrow, Alaska ≥ -50°F = 2 Days Feb. 3 - 4, 2006 ≥ -30°F = 9 Days Jan. 29 - Feb. 6, 2006 ≥ 0°F = 71 Days Jan. 4 - Mar. 15, 2005 ≥ 32°F = 223 Days Oct. 16, 2004 through May 27, 2005
Winter AVERAGE Temperature Data (°F) for Barrow, Alaska CRN Winters (Dec, Jan, Feb) of 2002-2007: (Average Temperatures and Departures derived from 1971-2000 Barrow NWS Normals) WinterTemperature Departure 2002-03 -10.1°F +3.3°F 2003-04 -13.8°F -0.4°F 2004-05 -10.6°F +2.8°F 2005-06 -8.5°F +4.9°F 2006-07 -10.6°F +2.8°F
CRN Network Record Precipitation Events (Inches), 2002-2007 • Greatest 30-Day = 51.35 Quinault, WA Nov. 1-30, 2006 • Greatest 7-Day = 27.39 Quinault, WA Nov. 2-8, 2006 • Greatest 5-Day = 25.12 Quinault, WA Nov. 3-6, 2006 • Greatest 1-Day = 11.78 Quinault, WA Nov. 6, 2006 • Greatest 60-Minute = 3.19 Lafayette, LA Oct. 4, 2005 • Greatest 30-Minute = 2.56 Lafayette, LA Oct. 4, 2005 • Greatest 15-Minute = 1.35 Lafayette, LA Oct. 4, 2005
RECORD PRECIPITATION -2 • Total precipitation measured at the Quinault CRN station on the Olympic Peninsula of Washington State for the “water year”-to-date (Oct 1, 2006 through March 14, 2007) is 136.06 inches in 5.5 months. • This is 38.34 inches greater than the 37- year mean precipitation record (for the same calendar period) of 97.72” set at the old Ranger Station site 1 mile SSW.
Miscellaneous CRN Records • Greatest 8-Hour Ground Surface Temperature Rise = 92°F (17°F to 109°F), measured on Feb 17, 2006 at Mauna Loa, Hawaii 11,179 ft elevation • Greatest 5-Minute Rise In Air Temperature = 11°F Boulder, Colorado 9828 ft elevation December 15, 2005 • Greatest 10-Minute Rise in Air Temperature = 17°F Boulder, Colorado 9828 ft elevation December 15, 2005 • Longest Period With No Precipitation = 134 days Tucson, Arizona Oct. 18, 2005 – Mar. 1, 2006.