Download
1 / 15
160 likes | 189 Vues
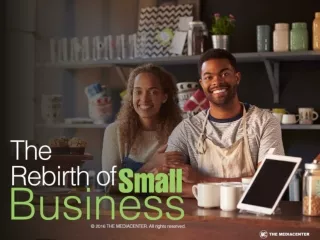
Main Street Masters of Business. According to the latest statistics from the US Small Business Administration, there were 28.8 million small businesses, which are defined as employing 500 or fewer employees, and they employ 48.0% of the private workforce, 56.8 million people.

E N D
Main Street Masters of Business • According to the latest statistics from the US Small Business Administration, there were 28.8 million small businesses, which are defined as employing 500 or fewer employees, and they employ 48.0% of the private workforce, 56.8 million people. • US Census Bureau data reveal that 91% of US businesses employ four people or fewer. • The US Small Business Administration calculates that 54% of total US sales occur at small businesses.
Job-Growth Generators • In its monthly National Employment Report, ADP stated that small businesses, or those with 49 or fewer employees, were responsible for 63,000, or 35.6%, of the 177,000 new non-farm, private-sector jobs created during August 2016. • During April and June 2016, small business generated more than 50% of all new US jobs, at 59.6% and 55.2%, respectively. • This Special Report from THE MEDIACENTER offers insights into today’s small businesses, which should help you address their needs and pain points and make a meaningful and significant contribution to their growth.
America’s Small Business Owners • Surveys and studies vary in their data about who are small business owners, but many are in agreement that men and Caucasian Americans are the majority of owners, although there is a recognizable trend toward more ownership diversity. • Babson College’s The State of the Small Business in America 2016 survey found that the median age for small business owners was 48.5, with 53.7% male ownership and 45.5% female ownership. • Generation Xers represented the largest percentage by age group, at 48.6%, and 57.0% had some college or a degree and 38.2% had some postgraduate work or a postgraduate degree.
Ownership Diversity • The Kauffman Index, Main Street Entrepreneurship, 2015 reported that 20.6% of US small business owners were immigrants during 2014, and have increased 10.9% since 1996. • The Index also found increasing ethnic diversity, with Latino American small business ownership increasing 5.6% and Asian American ownership increasing 3.8% since 1996. • Small business ownership among Caucasian Americans decreased from 86.9% to 72.0% during the same period.
Inside the Heads of Small Business Owners • According to the National Federation of Independent Business (NFIB) August 2016 Small Business Economic Trends report, its Optimism Index was 94.4, slightly less than July, but better than the first five months of the year. • It’s probably safe to conclude that the presidential election and the approach of the holiday shopping season may have generated more anxiety and fear and this lower index. • The NFIB’s Small Business Sales Expectation Index was also slightly pessimistic, as it was -1% for August, compared to 1% during April, May and July and 2% for June.
More Upbeat Results • In the Q3 2016 Gallup/Wells Fargo Small Business Survey, the Small Business Index for the first three quarters of 2016 was relatively as good as 2015, and Q3 2016 was noticeably better than Q3 2015. • When asked about their current financial situation, the “very good” and “somewhat good” results of 26% and 42%, respectively, were essentially unchanged from Q1 and Q2 2016. • Of those responding to the Gallup/Wells Fargo survey, 10% expected a “large increase” and 31% a “small increase” in their company’s revenues during the next 12 months.
Employee Diversity • According to the October 2015 opinion poll, Small Businesses Hire Diverse Entry-Level Workforce, from Small Business Majority, 69% of the small business owners participating in the poll said they have at least one female employee. • The poll also found that 24% of small business owners had at least one Hispanic employee, 18% at least one African American employee and 8% at least one employee with a disability. • The poll also revealed less diversity among management positions, but many small businesses are sole proprietorships, so there are very few, if any, management jobs for anyone, regardless of gender, ethnicity or disability.
Small Business Marketing Challenges • According to the Q3 2016 Gallup/Wells Fargo Small Business Survey, “attracting customers/targeting business opportunities/finding work/new business” continues to be the #1 challenge among small business owners. • “Marketing/advertising/reaching potential customers/being noticed” was 11th on the list. • July 2016 research from RevLocal found that 37.5% of US small businesses plan to increase their marketing budgets during the next year, compared to just 5.4% planning to decrease their budget.
Diving into Digital • BIA/Kelsey categorizes small businesses that spend more than $25,000 annually on advertising and promotion as Plus Spenders. • Plus Spenders who used the video and mobile digital channels to promote their businesses during the 12-month period ending May 2016 spent the most ad dollars, $87,923 and $81,663. • During this same period, Plus Spenders allocated 21.0% of their ad dollars to social media, 14.0% to mobile and 13.7% to TV, supporting once again that a combination of digital channels and TV is SMBs’ best media mix.
Let Your Digital Media Expertise Shine • A January 2016 survey of SMBs found that 89% of them were either already using or planned to use Facebook during 2016; followed by Twitter, 49%; LinkedIn, 42%; Pinterest, 31%; Instagram, 28%; and Snapchat, 11%. • When you can convince your clients that you have a thorough understanding of digital media and can provide them with useful digital media content and promotional ideas, you are more likely to receive a larger share of their ad dollars. • Please read Tom Ray’s comments in the lead story in THE MEDIACENTER’s September Newsletter to learn more about why you have a clear advantage when you present yourself as both a digital media and TV media AE.
Being Both Small and Large • A June 2016 article on the GeoMarketing Website reports that many of the small, innovative retail start-ups have discovered that the traditional goal of growing into a department store-sized physical footprint is no longer necessary or beneficial. • The strategy that seems to be working for these new retailers is to create interest and engagement with social media and build a customer base in e-commerce. • Only then do they open one or more brick-and-mortar stores, but with much smaller physical footprints to serve as showrooms or where customers pick up what they ordered online.
An Opportunity for You and Small Businesses • With your expertise in both TV and digital media, you’re in an advantageous position to guide more local businesses through this evolution to become a store that appears large in the digital channel, but still maintains a local Main Street presence. • You’re able to provide them with the stability of TV to build, promote and sustain their brand. • You are also able to help them use digital efficiently and effectively to engage with more consumers, increase sales and welcome customers to their stores when they choose to use that channel.