Building an IO Model
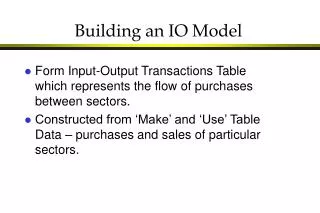
Building an IO Model. Form Input-Output Transactions Table which represents the flow of purchases between sectors. Constructed from ‘Make’ and ‘Use’ Table Data – purchases and sales of particular sectors. . Building an IO Model.

Building an IO Model
E N D
Presentation Transcript
Building an IO Model • Form Input-Output Transactions Table which represents the flow of purchases between sectors. • Constructed from ‘Make’ and ‘Use’ Table Data – purchases and sales of particular sectors.
Building an IO Model • Sum of Value Added (non-interindustry purchases) and Final Demand is GDP. • Transactions include intermediate product purchases and row sum to Total Demand. • From the IO Transactions table, form the Technical Requirements matrix by dividing each column by total sector input – matrix D. Entries represent direct inter-industry purchases per dollar of output.
Transactions Table Xij + Fi = Xi; Xi = Xj; using Aij = Xij / Xj (Aij*Xj) + Fi = Xi in vector/matrix notation: A*X + F = X => F = [I - A]*X or X = [I - A]-1*F
Two Sector Numerical Example • Reading across: Sector 1 provides $150 of output to sector 1, $500 of output to sector 2, and $350 of output to consumers. • Reading down: Sector 1 purchases $150 of output from sector 1, $200 of output from sector 2, and adds $650 of value to produce its output • Transaction Flows ($) are at right.
Requirements Matrix • Creating the A matrix • Aij = Xij / Xj • So, to make $1 of output from sector 1 requires $0.15 of output from the same sector.
Production of Good 1 in our Two Sector Model $ 0.15/$ Good 1 $ 1 Good 1 Sector 1 $0.2/$ Good 2 To produce $1 of output from sector one requires $0.15 of goods from the sector itself, plus $0.2 of goods from sector 2. Sector 2
Production of Good 2 in our Two Sector Model To produce $1 of output from sector two requires $0.05 of goods from the sector itself, plus $0.25 of goods from sector 1. Sector 1 $0.25/$ Good 2 $ 0.05/$ Good 2 Sector 2 $ 1 Good 2
Leontief Inverse • [I – A] • [I – A] -1 or X = [I - A]-1*F
Add Final Demand • Determine the effects of $100 additional demand from Sector 1 • X = [I – A] -1 F • Total Outputs: $125.4 of Sector 1 and $26.4 of Sector 2, or $ 151.8 Total. • Direct intermediate inputs: $15 of 1 and $20 of 2 for $100 output of 1 (or $ 135)
Add Environmental Effects • Add sector-level environmental impact coefficient matrices (R) • [effect/$ output from sector] • Example: Hazardous Waste Generation (R) • R1 = 100 grams/$ in Sector 1 • R2 = 5 grams/$ in Sector 2
Production of Waste in our Two Sector Model $ 0.15/$ Good 1 $ 1 Good 1 Sector 1 Haz. Waste 100 gm/$ Good 1 $0.2/$ Good 2 Haz Waste 5 gm/$ Good 2 Sector 2
Production of Waste in our Two Sector Model Sector 1 Haz. Waste 100 gm/$ Good 1 $0.25/$ Good 2 $ 0.05/$ Good 2 Haz Waste 5 gm/$ Good 2 Sector 2 $ 1 Good 2
Production of Waste in our Two Sector Model • B = R*X • 12,540 grams of hazardous waste generated by sector 1 • 132 grams of hazardous waste generated by sector 2 • Total of 12672 grams hazardous waste generated