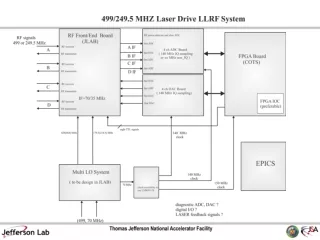
Download
1 / 25
270 likes | 355 Vues
Explore GLAS's role in analyzing aerosols and clouds, its observation techniques, and global cloud distribution insights. GLAS data visualization examples and comparisons with other models are provided.

E N D
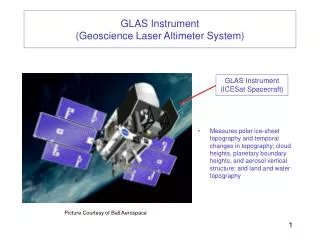
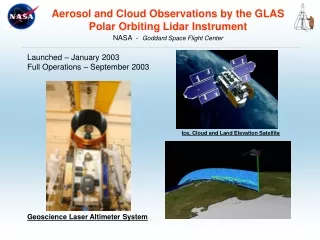
Aerosol and Cloud Observations by the GLAS Polar Orbiting Lidar Instrument NASA - Goddard Space Flight Center Launched – January 2003 Full Operations – September 2003 Ice, Cloud and Land Elevation Satellite Geoscience Laser Altimeter System
Surface Altimetry and Atmospheric Profiling Surface Altimetry – High Bandwidth, 10 cm, Strong Signals Atmospheric Profiling – Low Bandwidth, 30 m, Weak Signals >>>> Compatible System Requirements Surface Altimetry Requires Precise Cloud Clearing Atmospheric Retrieval Requires Surface Reflectance Measurement
GLAS Transmitter and Receiver Lasers: Three Diode Pumped Nd:YAG Units 40 Hz PRF 100 urad Beam Width 1064 nm - 65 mJ 532 nm - 36 mJ Receiver: One Meter Beryllium Mirror 1064 nm (main surface channel) Avalanche Photodiode Detector 1 gHz Surface Digitizer Channel 2 mHz Cloud Digitizer Channel 532 nm (high sensitivity atmospheric channel) 8 Geiger Mode Silicon APD Modules 2 mHz Photon Counting Channel
GLAS Measurement Components Atmospheric Profiles at 1064 and 532 nm S(z) = C E B(z) Te2(z) /r2 Aerosol and Thin Cloud: 532 nm – GAPD Photon Counting Denser Cloud: 1064 nm – Analog APD Vertical Resolution – 75 m (20 m) Horizontal Resolution - ~ 175 m (500m) Signal Range - -5 to 40 km Surface Return Pulse at 1064 nm Es=Eo Te2 A/r2 = Cp Te2 (zo) Surface Pulse Waveform Surface Pulse Reflectance Vertical Resolution – 15cm Signal Range - -100 to 300 m Solar Background Radiance at 1064 and 532 P = I A Sp = Cb I
West Antarctic - Siple Coast from ICESat SIPLE COAST ICE STREAMS Crary Ice Rise Grounding line SIPLE DOME ROSS ICE SHELF Ben Smith Univ. of Washington
CLOUDS I’ve looked at clouds from both sides now…..
GLOBAL ORBIT LIDAR VIEWS OF CLOUD AND AEROSOL DISTRIBUTION FROM GLAS QUICK LOOK WEB SITE: http://glo.gsfc.nasa.gov/
GLAS Data Visualization for October 3, 2003
GLAS Observed Backscatter Cross Section and Layer Heights Data Product Example (gla07,08, 09)
Latent Heat Flux Sensible Heat Flux 12 km 8 km GLAS PBL ECMWF PBL 4 km Validation of Global Circulation Models (GCM’s) Detailed Comparison of GLAS And European Center Weather Forecast Model Boundary Layer Heights Cloud Fraction
01 Oct. – 15 Nov. 2003 Cloud Layer Count DistributionAll clouds • Global cloudiness is 69% • Single layers account for 64% of cloudy cases • Attenuation causes layer numbers to be undercounted • Shape of distribution is typical 45% 31% 17%
PSC http://wikimediafoundation.org/wiki/ Maximum cloud height 01 Oct. – 15 Nov. 2003 km • Maximum cloud height in each cell over the observation period. • Some features: warm pool; tropical central Africa; Carribbean; western coasts of the continents. • Line plot shows the zonal maximum cloud height; note polar stratospheric clouds.
Zonal Cloud Top Frequency 01 Oct. – 15 Nov. 2003 0.5 km vertical bins • Top shows results from all observations • Two lower images show the comparison between the AM and PM observations. • Differences are the increase in the convective influence in the PM, with a lessening of the influence of the low clouds. AM and PM AM PM
October, 2003 GLAS, PM MODIS,AQUA Percent Percent GLAS MODIS GLAS/MODIS Cloud Fraction Comparison • Features in the expected locations. • High cloud fraction the the ITCZ and north and south circumpolar regions. • Low cloud fraction in deserts. • GLAS finds significantly more cloudiness in the deserts regions. • Zonal cloud fraction display shows excellent agreement between the two instruments except in the polar regions. Cloud fraction, zonal
Zonal cloud top pressure GLAS MODIS GLAS/MODIS Average Cloud Top Pressure Comparison October, 2003 GLAS, PM MODIS,AQUA hPa hPa • GLAS results show higher clouds • GLAS finds geometrical cloud top; MODIS finds thermal cloud top • Other factors such as sampling differences are needed to explain large difference
GLAS MODIS GLAS Aerosol Optical Thickness October, 2003 GLAS, PM MODIS,AQUA OD OD • Qualitative agreement in location of many persistent features • GLAS misses transient features such as California fire because of sampling. • GLAS retrieves generally lower OD because of a low bias in extinction to backscatter ratio.
Global Aerosol and Boundary Layer Height First Mapping of the Global Aerosol and Pollution Capping Inversion ‘Boundary Layer’ Height GLAS Measurement of the Height of the Planetary Boundary Layer – October 2003 Model Output from European Center Forecast Model
Geoscience Laser Altimeter System Application to Aerosol Transport Models GLAS 532 nm Data Naval Aerosol Analysis and Prediction System J. Spinhirne /GSFC January 2004
GLOBE GLOBE - Global Backscatter Experiment Definition of Space Lidar Requirements • Observe backscatter cross sections below 10-7 (1/m-sr) for aerosol transport • Observe backscatter cross sections up to 10-3 for dense aerosol events • Observe backscatter cross sections over six orders of magnitude including clouds Menzies, Tratt, Spinhirne and Hlavka - JGR 2002 .
GLAS Observation Periods Observation Period 1064 nm Laser 532 nm Feb 20 – Mar 28 2003 Excellent 1 None Sep 25 – Nov 18 2003 Excellent 2 Excellent Feb 17 – Mar 21 2004 Excellent - Good Excellent - Good 2 May 18 – Jun 21 2004 Fair (Night Only) 2 Fair Oct 03 – Nov 07 2004 Poor (Night Only) 3 Excellent GLAS STATUS • Global lidar data are a fundamentally new measurement from space for global aerosol and cloud cover. • GLAS data results have fully validated the science, technology and observation strategy and meet the objective of profiling all radiatively significant cloud and aerosol layers. • GLAS Data products are in open release to the science community. • Quick look and data visualization: http://glo.gsfc.nasa.gov/ • Full Data Access: http://nsidc.org/daac/ Laser Diode Failure Laser Contamination Severe Contamination Laser Doubler Failure 2005: Feb. 20 – Mar. 25 May 18 – June 22