Correlated characters
310 likes | 432 Vues
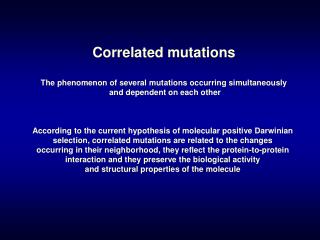
This work explores the relationships between two metric characters in a population whose values are correlated. It highlights the importance of correlated characters and introduces the concept of pleiotropy, whereby a single gene can influence multiple traits. The paper discusses how improvements in one character affect others through selection and examines both genetic and environmental factors contributing to phenotypic correlations. Methods, such as ANCOVA for estimating genetic correlations using half-sib family designs, are also covered, providing insights into the complexities of quantitative genetics.

Correlated characters
E N D
Presentation Transcript
Correlated characters Sanja Franic VU University Amsterdam 2008
Relationship between 2 metric characters whose values are correlated in the individuals of a population
Relationship between 2 metric characters whose values are correlated in the individuals of a population • Why are correlated characters important? • Effects of pleiotropy in quantitative genetics • Pleiotropy – gene affects 2 or more characters • (e.g. genes that increase growth rate increase both height and weight) • Selection – how will the improvement in one character cause simultaneous changes in other characters?
Relationship between 2 metric characters whose values are correlated in the individuals of a population • Why are correlated characters important? • Effects of pleiotropy in quantitative genetics • Pleiotropy – gene affects 2 or more characters • (e.g. genes that increase growth rate increase both height and weight) • Selection – how will the improvement in one character cause simultaneous changes in other characters? • Causes of correlation: • Genetic • mainly pleiotropy • but some genes may cause +r, while some cause –r, so overall effect not always detectable • Environmental • two characters influenced by the same differences in the environment
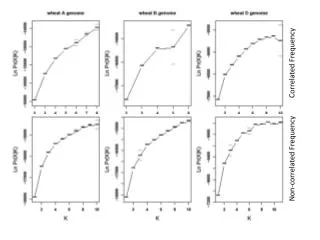
We can only observe the phenotypic correlation • How to decompose it into genetic and environmental causal components?
(phenotypic correlation) (phenotypic covariance) (phenotypic covariance expressed in terms of A and E) (substitution gives) (because σ2P= σ2A+ σ2E σP= σA+ σE σP=hσP+eσP) (substitution gives) (phenotypic correlation expressed in terms of A and E) • We can only observe the phenotypic correlation • How to decompose it into genetic and environmental causal components?
(phenotypic correlation) (phenotypic covariance) (phenotypic covariance expressed in terms of A and E) (substitution gives) (because σ2P= σ2A+ σ2E σP= σA+ σE σP=hσP+eσP) (substitution gives) (phenotypic correlation expressed in terms of A and E) • We can only observe the phenotypic correlation • How to decompose it into genetic and environmental causal components?
Estimation of the genetic correlation • Analogous to estimation of heritabilities, but instead of ANOVA we use an ANCOVA
Estimation of the genetic correlation • Analogous to estimation of heritabilities, but instead of ANOVA we use an ANCOVA Half-sib families • Design: a number of sires each mated to several dames (random mating) • A number of offspring from each dam are measured
Estimation of the genetic correlation • Analogous to estimation of heritabilities, but instead of ANOVA we use an ANCOVA Half-sib families • Design: a number of sires each mated to several dames (random mating) • A number of offspring from each dam are measured s=number of sires d=number of dames per sire k=number of offspring per dam
Estimation of the genetic correlation • Analogous to estimation of heritabilities, but instead of ANOVA we use an ANCOVA Half-sib families • Design: a number of sires each mated to several dames (random mating) • A number of offspring from each dam are measured s=number of sires d=number of dames per sire k=number of offspring per dam observational components
Estimation of the genetic correlation • Analogous to estimation of heritabilities, but instead of ANOVA we use an ANCOVA Half-sib families • Design: a number of sires each mated to several dames (random mating) • A number of offspring from each dam are measured s=number of sires d=number of dames per sire k=number of offspring per dam observational components causal components
σ2S= variance between means of half-sib families (phenotypic covariance of half-sibs) = ¼ VA
σ2S= variance between means of half-sib families (phenotypic covariance of half-sibs) = ¼ VA σ2W VT = VBG + VWG VWG = VT – VBG VBG = covFS covFS = ½ VA + ¼ VD σ2W=VWG = VT -½ VA - ¼ VD = VA + VD +VE -½ VA - ¼ VD = ½ VA + ¾ VD + VEW
σ2S= variance between means of half-sib families (phenotypic covariance of half-sibs) = ¼ VA σ2W VT = VBG + VWG VWG = VT – VBG VBG = covFS covFS = ½ VA + ¼ VD σ2W=VWG = VT -½ VA - ¼ VD = VA + VD +VE -½ VA - ¼ VD = ½ VA + ¾ VD + VEW σ2D= σ2T-σ2S -σ2W = VA + VD +VE -¼ VA -½ VA – ¾ VD - VEW = ¼ VA + ¼ VD + VEC (VE = VEC +VEW)
σ2S= variance between means of half-sib families (phenotypic covariance of half-sibs) = ¼ VA σ2W VT = VBG + VWG VWG = VT – VBG VBG = covFS covFS = ½ VA + ¼ VD σ2W=VWG = VT -½ VA - ¼ VD = VA + VD +VE -½ VA - ¼ VD = ½ VA + ¾ VD + VEW σ2D= σ2T-σ2S -σ2W = VA + VD +VE -¼ VA -½ VA – ¾ VD - VEW = ¼ VA + ¼ VD + VEC (VE = VEC +VEW) • In partitioning the covariance, instead of starting from individual values we start from the product of the values of the 2 characters covS= ¼ covA
covS= ¼ covA • varSX = ¼ σ2AX • varSY = ¼ σ2AY
covS= ¼ covA • varSX = ¼ σ2AX • varSY = ¼ σ2AY Offspring-parent relationship • To estimate the heritability of one character, we compute the covariance of offspring and parent • To estimate the genetic correlation between 2 characters we compute the “cross-variance”: product of value of X in offspring and value of Y in parents • Cross-variance = ½ covA
covS= ¼ covA • varSX = ¼ σ2AX • varSY = ¼ σ2AY Offspring-parent relationship • To estimate the heritability of one character, we compute the covariance of offspring and parent • To estimate the genetic correlation between 2 characters we compute the “cross-variance”: product of value of X in offspring and value of Y in parents • Cross-variance = ½ covA
Correlated response to selection • If we select for X, what will be the change in Y?
Correlated response to selection • If we select for X, what will be the change in Y? • The response in X – the mean breeding value of the selected individuals • The consequent change in Y – regression of breeding value of Y on breeding value of X
Correlated response to selection • If we select for X, what will be the change in Y? • The response in X – the mean breeding value of the selected individuals • The consequent change in Y – regression of breeding value of Y on breeding value of X
Correlated response to selection • If we select for X, what will be the change in Y? • The response in X – the mean breeding value of the selected individuals • The consequent change in Y – regression of breeding value of Y on breeding value of X because:
[11.4] Coheritability
[11.4] Coheritability [11.3] Heritability