Download
1 / 71
730 likes | 888 Vues
Water Information Management Solution: Product Demo for Waste Water. Table of Contents. Product overview Product demo Customer testimonials Static slides (product screen shots) Case studies. WIMS Product Overview. Table of Contents. Water Industry Data Management The “Right” Solution.

E N D
Water Information Management Solution: Product Demo for Waste Water
Table of Contents • Product overview • Product demo • Customer testimonials • Static slides (product screen shots) • Case studies
WIMS Product Overview Table of Contents
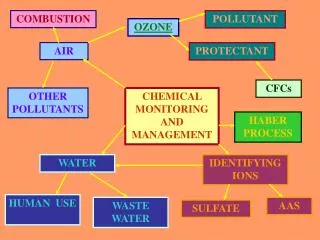
Water Industry Data ManagementThe “Right” Solution LIMS Hach WIMS™ Excel Laboratory Data Process Data Other Data SCADA
All the data you need is at your “fingertips,” in a secure, auditable database Data sources: Manual entry SCADA interfaces Grab data from Intellution, Wonderware, Rockwell, SCADA systems, etc Grab data from Hach sc network Summarize Store in WIMS LAB interfaces Import data from your commercial labs Import data from your Hach lab instruments (DR, HQ, etc) Import from your LIMS Automatic calculations
Accurate Information – Informed Decisions • Data comes together in a central database • Easy access, local or over secure Web • Data ALWAYS available • Safe and secure historical records • Accurate data entered one time • Audit trails
Table of Contents WIMS Demonstration Tool
Areas of Discovery and Exploration(Click on hyperlink to navigate to the “Area of Discovery”) Monitor & Improve Operations Troubleshoot Issues Prepare Regulatory & Internal Reports Easily Compile Data Manage Complex Calculations
Monitor and Improve Operations Dashboards Manage data by exceptions Alert Notifications Compliance graphs
Manage Data by Exception The Compliance Engine scans your database for regulatory violations and QC Flags. Click Data Manager Select Events
Alert Notifications List of all Scheduled Tasks includes Event Violation Report Sample of an Alert Email Sample Report Click System Setup Select Scheduled Tasks Add or Edit Tasks View Emailed Alert View Attached Report
Compliance Graphs Notice that the graphs contain permit or user defined limits. For Example, the graph shows 1 violation for Effluent TSS This screens sets the Optionsfor Multiple Graph OutputThis report contains 8 compliance graphs Click Compliance Graphs Select your Options Click OKto view the Graphs The graphs include Limit Lines for easy viewing of exceptions Click Nextto view other graphs
Areas of Discovery and Exploration(Click on hyperlink to navigate to the “Area of Discovery”) Monitor & Improve Operations Troubleshoot Issues Prepare Regulatory & Internal Reports Easily Compile Data Manage Complex Calculations
Troubleshoot Issues • Flag problems in the data / Audit Trails • Verify equations • Highlight exceptions with graphs
Flag Problems in the Data Values above limits are bolded. Comments (red dot) can be imbedded in the cell The Audit Trail is a “fingerprint” for the data. You know who entered the data, deleted or changed the data. This gives you the piece of mind knowing that the data is safe. The comments help explain that the violation was due to a broken drive belt. Click Review Report Notice the Bold Text and Red Dots Right-clickon a result to open the menu Select Result Comment to view or add a comment Select Audit Information
Verify Equations Equation is in plain English, therefore easy to understand, verify, and, unlike Excel, does not break down if changes are made to the cell On Review Form Double-Click Equation Box View the explained equation
Highlight Exceptions with Graphs We have correlation. Does this hold true over a longer period of time? True enough, the correlation holds Note how easy (and quick) it was to conduct this Infiltration Study. Contrast this with any other commercially available software! Click Graph Pac Select Time Series Click Add to add variables Click Viewto view graph Change to 90 Day View
Areas of Discovery and Exploration(Click on hyperlink to navigate to the “Area of Discovery”) Monitor & Improve Operations Troubleshoot Issues Prepare Regulatory & Internal Reports Easily Compile Data Manage Complex Calculations
Prepare Regulatory & Internal Reports • Wastewater compliance reports • Numerous report templates • Create reports with wizard • Schedule automatically delivered reports
Wastewater Compliance Reports With a click of a button, the program gathers all the information for your regulatory report and prints it automatically …and, here is the DMR for the previous month, December 2008, accessed with just a few clicks!. Click on NPDES Report View the Last Full Month’s Report Click the Month Selector to change months Select December 2008 and click OK
Numerous Report Templates Click on Help Select Templates – Spread Report Templates Click Florida Waste Water from the list Click Preview to view the template
Create Reports with Wizard Click the date selector to move back a month When you are satisfied, Savethis report as a template, so that is available, in future, on-demand. You can view the report under the “Report Pac” menu The Spread Report Designer looks like a Spreadsheet, but it is much more than just a single spreadsheet. Based on the selections made, WIMS builds your report. Click on Design Select Spread Reports to begin a new report The Spread Designer opens, note it looks like a spreadsheet Click Lightning Bolt to start the wizard Move through the Wizard by clicking Next When finished your report will appear The data is not static, you can change dates Click Save to save the report
Create Reports with Wizard Here it is! There are many Optionsthat can be used to output any report Click on Report Pac SelectSpread Reports Select demo report to open the report you just created Note all the optionswhen generating a report Click OKto view the report on the screen
Schedule Automatically Delivered Reports Note all the different Output Devicesand Formats Click System Setup Select Scheduled Tasks Click Newto create a new alert Move through the Tabsto define what you want to schedule Click OKto finish scheduling this new task
Areas of Discovery and Exploration(Click on hyperlink to navigate to the “Area of Discovery”) Monitor & Improve Operations Troubleshoot Issues Prepare Regulatory & Internal Reports Easily Compile Data Manage Complex Calculations
Easily Compile Data • Manual data entry • Automatic data entry through interfaces
Manual Data Entry Note that Effluent pH can swing between Daily Limits 6 pH to 8 pH and Entry Limits of 5 to 10. Hach WIMS will alert me if I enter a value outside these limits in this cell Oops, I forgot to include the decimal point. Click on System Setup SelectEdit/View Variable Click Interface tab (note: this is only available to certain admin users Note all the optionsavailable to configure an Interface
Automatic Data Entry through Interfaces Click Interface Tab Note that, once daily, the program imports data automatically via an interface for iFix Historian (formerly GE Intellution), totalizes the data before storing it in the database Select “Edit/View Variables” Click on System Setup SelectEdit/View Variable Click Interface tab (note: this is only available to certain admin users Note all the Optionsavailable to configure an Interface
Areas of Discovery and Exploration(Click on hyperlink to navigate to the “Area of Discovery”) Monitor & Improve Operations Troubleshoot Issues Prepare Regulatory & Internal Reports Easily Compile Data Manage Complex Calculations
Manage Complex Calculations • Huge library of functions • Support for complex calculations
Huge Library of Functions Scroll down and Select WAVGn 100+ water and wastewater specific equations Click “Function Reference” Weekly average is simply an average of 7 numbers, but what is the definition of a week? Click to find out Click on Help SelectChapters > Function Reference Click Math Toolbox Functions Scroll to find the WAVGnfunction Powerful functions with lots of options Click defines the week to see the week options
Huge Library of Functions Is it Sunday to Saturday, Monday to Sunday,…1st to the 7th, 7th to the 14th,…How is a week different for February vs. March?...Leap year vs. not?..... There are 21 definitions of the week, as defined by State and Federal regulations. This is a good example of how Hach WIMS takes a seemingly simple (but very complicated) tasks and greatly simplifies the calculation.
Support for Complex Calculations Examine a complex calculation, Food to Microorganism Ratio F/M ratio is a complicated equation based on Primary Eff BOD Load, Mixed liquor volatile suspended solids and the number of active aeration basins. Hach WIMS manages this complicated equation! In a Data Entry Form select a calculated result Double-click the Equation box WIMS supports very complex calculations
Table of Contents Customer Testimonials
Monitor & Improve Operations “Hach WIMS has fostered analysis beyond regulatory data. Information on pumping stations, energy usage, material usage, and cost analysis are just a few of the trends performed to enhance ‘optimization.’ The new question is not ‘Can we analyze the data?’ but ‘Which data do you want to analyze?’” Gwinnett County, GA
Monitor & Improve Operations “We love this software. I have the time to give this reference because I have the software!” James Grandstaff Division Director Henrico County Water Reclamation Facility, VA
Monitor & Improve Operations “The Hach WIMS product has been instrumental in the collection of relevant data. Its data capture and reporting capabilities have provided us a comprehensive analysis of our wetlands pilot project.” Stephanie Eisner Natural Reclamation System Proj. Coordinator City of Salem, WA
Monitor & Improve Operations “Hach WIMS has fostered analysis beyond regulatory data. Information on pumping stations, energy usage, material usage, and cost analysis are just a few of the trends performed to enhance ‘optimization.’ The new question is not ‘Can we analyze the data?’ but ‘Which data do you want to analyze?’” Gwinnett County, GA
Prepare Regulatory & Internal Reports “The biggest advantage in our implementation of Hach WIMS is the automation of our reports. Reports that typically would take weeks at a time to prepare, now only take us a matter of a few hours. Additionally Hach WIMS fills a much needed gap. Our Operations Department now has access to data that allows them to make adjustments within their operational parameters in hours – instead of days.” Peter Chang, System Engineer III King County, WA
Easily Compile Data “Hach WIMS is central to everything that the LEWWTP does. Each system that the LEWWTP has provides data into Hach WIMS. It is essential to our process decisions.” Brenna Durkin DBA Specialist Littleton/Englewood Wastewater Treatment Plant
Static slides (Use for non-demo presentations) Table of Contents
User Defined Dashboards Hach created examples Customer generated
Manage by exception… The Compliance Engine scans your database for regulatory violations and QC Flags.
Manage by exception… Track events (violations or user defined) and setup email alerts…
Compliance charts Automatically chart data for key plant parameters.
Central location for all of your data View of the database that showcases how parameters (variables) are organized Wastewater Drinking water