Effects of Oil and Hormonal Treatments on mPRβ and mPRγ Gene Expression in Ovary Tissue
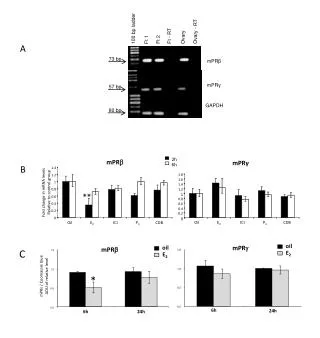
This study investigates the impact of various oil treatments and hormonal agents (E2, ICI, P4, CDB) on the expression levels of mPRβ and mPRγ in ovary tissue samples, measured at different time points (0.6h, 2h, 6h, 24h). qPCR analysis and relative fold changes in mRNA levels compared to control groups are presented, highlighting how these treatments influence gene expression patterns. Understanding these interactions offers insights into reproductive biology and potential therapeutic applications.

Effects of Oil and Hormonal Treatments on mPRβ and mPRγ Gene Expression in Ovary Tissue
E N D
Presentation Transcript
2h 6h A mPR mPRγ B 1.4 1.8 1.2 1.6 1 1.4 Fold change in mRNA levels Relative to control group 0.8 1.2 ** 1 0.6 0.8 0.4 0.6 0.4 0.2 0.2 0 100 bp ladder 0 Ovary - RT Oil E2 ICI P4 CDB Oil E2 ICI P4 CDB Ft - RT Ovary Ft 2 Ft 1 mPR oil oil mPRβ mPR C 73 bp E2 E2 mPRγ mPRs / Coomassie blue ADU of relative level * 57 bp GAPDH 80 bp 6h 24h 24h 6h
![Altitude= [0.2, 4.0km]](https://cdn4.slideserve.com/464372/nasa-s-cloud-absorption-radiometer-dt.jpg)