Bell Ringer
This comprehensive guide explores how needs and wants contribute to resource scarcity, and describes the factors of production that create goods and services. It delves into concepts such as trade-offs and opportunity costs, explaining why they are essential in decision-making for individuals, families, and nations. The Production Possibilities Curve (PPC) is introduced as a graphical representation of an economy's productive resources, showcasing efficiency, underutilization, and the effects of growth and shrinkage. Real-world examples illustrate the dynamic nature of economic choices and their implications.

Bell Ringer
E N D
Presentation Transcript
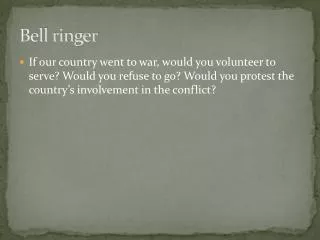
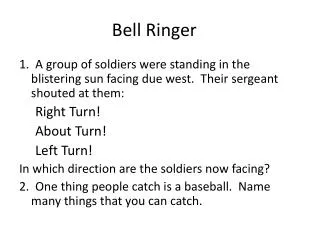
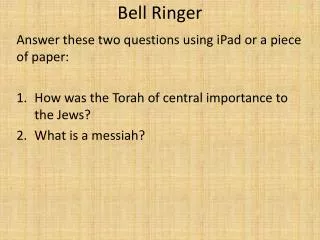
Bell Ringer • How do needs and wants lead to scarcity? • Describe how each factor of production helps to create a good. • Why are trade-offs and opportunity costs examined when making a decision?
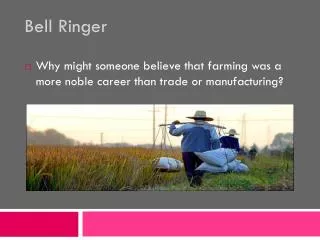
Production Possibilities Curves ECON 1.2 - Explain the concept of opportunity costs and how individuals, families, communities and nations make economic decisions on that basis, including analyzing marginal costs and marginal benefits and assessing how their choices may result in trade-offs.
What is a Production Possibilities Curve (PPC)? • A PPC shows alternative ways to use an economy’s productive resources. • It shows categories of goods and services, like farm goods and factory goods. • It can also show specific goods and services, like hats and shoes. • Economists use PPCs to make the most of our scarce resources and not waste what we have.
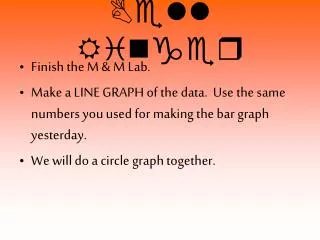
How to draw a PPC. • Decide which good or service to examine. We will use shoes and watermelons. • Create a graph and label. • Plot the points given in the chart to the left and connect the line.
What does the line mean? • The line you have just created is called Production Possibilities Frontier (PPF). • The PPF shows the maximum production of those two products using all of the resources available at that particular instance. • Each point on the line reflects a trade-off because resources are scarce.
Now you try • In your notes, create a PPC using the data to the right. • I will walk around to help
What does the graph mean? • Efficiency – using resources in such a way as to maximize the production or output of goods and services. • Underutilization (represented as a point inside the PPF) – means using fewer resources than the economy is capable of using. • Growth – occurs when there is a change in the quality or quantity of resources, i.e. new technology, increased population. This can make the graph “shift”. • Growth causes the PPF to shift to the right • Shrinking causes the PPF to shift to the left.
Complete the following questions: • How would you illustrate the impact of each of the following events on a production possibilities curve for factory goods and farm goods? • The computer is invented • 1 million farm workers remain unemployed • A drought • Describe a specific event that would make each of the following happen to a production possibilities curve. • A point moves down and to the left • The frontier shifts to the right.
What does the graph mean? • Cost – the alternative we give up when we choose one option over the other. • We use the PPC to show opportunity costs. • Law of Increasing Costs – as production switches from one item to another, trade-offs increase more and more
JOURNAL • How does scarcity and choice impact the economic activity of individuals, communities, and nations?