Download
1 / 19
190 likes | 307 Vues
Determine the best choice of a data display . BY:REGINE OLIVER. MAIN MENU. CIRCLE GRAPH LINE PLOTS BAR-GRAPHS WHISKER PLOTS. MISLEADING STALISTICS SAMPLING TO PREDICT DATA TO PREDICT GRAPHS TO PREDICTS. CIRCLE GRAPH. A CIRCLE GRAPH CAN BE ASSOCIATED WITH CHORDS OF A CIRCLE

E N D
Determine the best choice of a data display BY:REGINE OLIVER
MAIN MENU • CIRCLE GRAPH • LINE PLOTS BAR-GRAPHS • WHISKER PLOTS • MISLEADING STALISTICS • SAMPLING TO PREDICT • DATA TO PREDICT • GRAPHS TO PREDICTS
CIRCLE GRAPH • A CIRCLE GRAPH CAN BE ASSOCIATED WITH CHORDS OF A CIRCLE • USING A CIRCLE GRAPH TO DISPLAY CATEGORIES OF INFORMATION
LINE PLOTS • LINE PLOTS SHOWS DATA ON NUMBER LINE • MOST LINE PLOTS HAVE A TITTLE OR LABEL
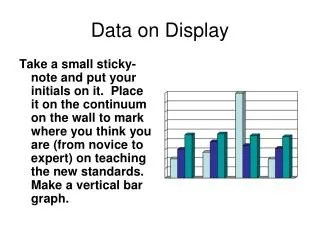
BAR-GRAPHS • A BAR-GRAPH HAS RECTANGLE BARS. • BAR-GRAPH ARE USED FOR COMPARING TWO MORE VALUES
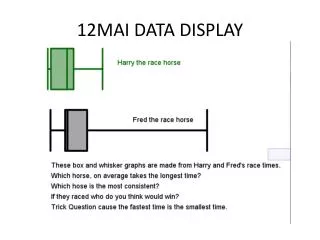
WHISKER PLOTS • WHISKER PLOTS DATA CAN BE DISPLAYED IN MANY WAYS • WHISKER PLOT CAN BE INNEDIATE VISUALS OF A BOX AND WHISKER PLOT
MISLEADING STATISTICS • STUDNTS ARE TOLD SO MUCH ABOUT WAYS OF MISLEADING WITH STATISTICS THAT PRESENTATIONS OF NUMBERS
SAMPLING TO PREDICT • SAMPLING TO PREDICT ACCURING TABEL • SAMPLING TO PREDICT YEAR 90% DISTRUBUTION LEVEL
DATA TO PREDICT • YOU CAN PREDICT OR DRAW CONCLUTION • IT CAN USE STATISTICS FOR DATA TO PREDICT
GRAPHS TO PREDICT • GRFAPHS TO PREDICT TERMS….... THE LINE GRAPHS SHOWS THE TIME IT WILL TAKE HIM TO
QUIZ MENU!!!!!!! • BAR-GRAPHS! • LINE PLOTS! • WHISKER PLOTS! • CIRCLE GRAPH!
QUESTIONS ABOUT BAR-GRAPHS WHAT IS THE BEST DEFINITION FOR BAR-GRAPHS? A diagram of lines made by connected data points A graph using parallel bars of varying lengths as to illustrate comparative costs Exports birth-rates
questions about line plots Can you use line plots to represent data? yes no