Download
1 / 1
10 likes | 101 Vues
This application provides runtime power monitoring and estimation for systems, focusing on diverse application power behaviors and phases. Real-time experiments guide dynamic power management techniques, leveraging counter-based estimations for detailed component power analysis. The tool tracks power phases and variability effects, optimizing power balancing and activity migration in multiprocessor systems. Phase detection under real-system variability is enhanced through transition-guided frameworks and event-counter-based approaches, promoting efficient power management strategies.

E N D
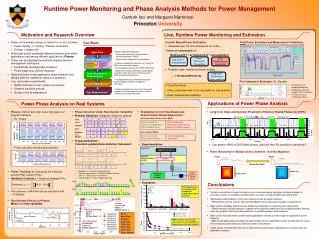
Application Application Binary Perfect repeatability Architectural independence Detail at program level Runtime applicability BBV phases ≢ power phases No physical binding to power Desired operating pointP{hit} ~ 1P{false alarm} ~ 0 Pintool Runtime monitoring Strong relation to power Imperfect repeatability Lack of detail 1 1 1 1 1 OS serial device file .7 .7 .7 .7 .7 .7 .3 .3 .3 .3 0 0 0 0 0 0 0 0 0 0 0 0 0 0 0 0 0 0 0 0 0 0 0 0 0 0 0 0 0 Performance CounterHardware 1 Gap Vortex Gzip Vpr Gcc Application Runtime Monitoring Crafty HardwarePerformanceCounters DynamicProgramFlow Power Estimation &Phase Analysis Dynamic Management Real Measurements DynamicInstrumentationvia Pin OS Hardware Power Meas.via Current Probe Error Number of Phases Runtime Power Monitoring and Phase Analysis Methods for Power Management Canturk Isci and Margaret Martonosi PrincetonUniversity Motivation and Research Overview Live, Runtime Power Monitoring and Estimation • Power is the primary design constraint for current systems • Power density Cooling / Thermal constraints • Energy Battery life • Workloads exhibit drastically different behavior both within applications and among different applications (Phases) • These can be exploited by workload directed dynamic management techniques • Dynamically reconfigurable hardware • Power balancing / Activity migration • Need methods to track application power behavior and identify different (repetitive) regions of operation • Live, real-system experiments: • Reflect behavior of real, modern processors • Observe long time periods • Guide on-the-fly adaptations Our Work: Counter Based Power Estimation: • Idealized view: For all components on a chip…. Total Power Estimates and Measurement Validation: Power of component I = ▪ Monitor application Execution: - Performance behavior via performance monitoring counters (PMCs) - Control flow via dynamic instrumentation MaxPower[I] * ArchScaling[I] * AccessRate[I] Die Area + Stressmarks From Microarch. Properties CPU Performance Counters! ▪ Represent application execution as a stream of PMC and control flow samples ▪ Estimate power behavior from PMC information ▪ Apply phase tracking, detection and prediction strategies under real-system effects based on PMC and control flow features • Realistic view: Handle non-linear scaling… Empirical Multimeter Measurements … + NonGatedPower[I] ▪ Use application phase information to guide dynamic/adaptive power management techniques Per-Component Estimates: Ex. Equake + Fast (Real-time) + Offers estimated view of on-chip detail for real systems + Real measurement validation • Initialization and computation phases • Initialization with high complex IA32 instructions • FP intensive mesh computation phase ▪ Employ real power measurements to provide feedback to runtime power estimations and to evaluate phase characterizations Applications of Power Phase Analysis Power Phase Analysis on Real Systems • Phases: Distinct and often-recurring regions of program behavior • Ex: Vortex • Phase Detection Under Real-System Variability: • Problem Definition: Variability effects on phases • Evaluating Control-Flow-Based and Event-Counter Based Approaches: • Long-Term Value and Duration Prediction of Memory Bound Phases for DVFS: Control flow (Basic Block Vectors / BBVs): Ideal Glitch Gradient Shift Event counters (PMCs): Mutation Time Dilation • Proposed Solution: Transition-guided phase detection framework: • Experimentation: • Can predict >90% of DVFS’able phases, with less than 5% prediction overshoots! • Power can also exhibit phase behavior 1 1 1 00…0 00…0 00…0 00…0 • Power Balancing for Multiprocessor Systems / Activity Migration: t Power Power Task1 Task2 1 1 1 1 1 1 00…0 00…0 00…0 00…0 00…0 t Swap hot task Core/μP 1 Core/μP 2 • Mutations Transition based tracking • Glitches and gradients Glitch/Gradient Filtering • Shifts ~Binary cross correlations • Time Dilations Near-neighbor blurring • Phase Tracking: By evaluating the similarity among PMC vectors (PVs): • Similarity Criterion: L1-Distance between PVs Speed up! Slow down! run1 • Evaluation: Match! 1 Conclusions t • Both approaches bring significant insights to application power behavior run2 • PVs achieve < 5W within phase variations with <10 phases • Certain compositions of event counters can provide reasonably accurate runtime estimates for processor power consumption and distribution of power among architectural components • Workloads exhibit phases in their performance as well as power behavior- Performance counter vectors help identify different (recurring) power phases of applications • Real system variability effects impose additional challenges for detecting recurrent phases- Phase transition guided approach, together with supporting methods such as glitch/gradient filtering and near-neighbor blurring enable detection of repetitive power phase behavior • Both control flow and event counter based application features provide insight to application power behavior- PMC based approaches generally provide a better proxy to application power phase behavior, due to their strong physical binding to processor power consumption • These phase oriented methods can be employed to guide range of applications in current and next generation systems t • Real-System Effects on Phases: Metric and time variability 0 detect thresholdP{hit} = 1P{false alarm} = 1 Best detection scheme achieves 100% hit detection with <5% false alarms • PMCs achieve (on average 40%) less errors than BBVs in power phase characterization Very high detect thresholdP{hit} = 0P{false alarm} = 0