Phillips Curve
Phillips Curve. Deriving the Phillips Curve from AD/AS Derive the Short and Long Run Phillips Curves What shifts the SRPC and the LRPC Short AND Long Term Effects of INFLATION on the Phillips Curve. LRAS. Phillips Curve. SRAS. Price Level. Inflation. B. PL1. A. PL*. AD1. C. PL2.


Phillips Curve
E N D
Presentation Transcript
Phillips Curve Deriving the Phillips Curve from AD/AS Derive the Short and Long Run Phillips Curves What shifts the SRPC and the LRPC Short AND Long Term Effects of INFLATION on the Phillips Curve
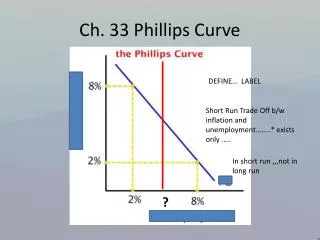
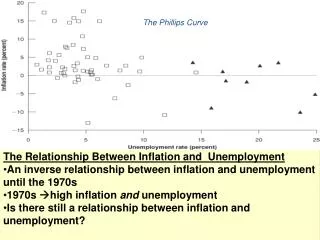
LRAS Phillips Curve SRAS . Price Level Inflation . B . PL1 A PL* AD1 C PL2 AD SRPC AD FE RDP2 RGDP1 Unemployment Real GDP RGDP* The Short-Run Phillips Curve illustrates the Trade-off between Inflation and Unemployment (derived from what is happening to RGDP) that occurs as the AD curve traverses (either up or down) the UPWARD sloping (Intermediate) range of SRAS.
LRAS Phillips Curve SRAS . Price Level Inflation . B . PL1 A PL* AD1 C PL2 AD SRPC AD FE RDP2 RGDP1 Unemployment Real GDP RGDP* IMPORTANT---Movement ALONG the SRPC corresponds with AD movement ALONG the Upward Sloping (Intermediate Range) of the SRAS Curve. The Phillips Curve is important because for A long time—post WWII—Fiscal Policy (FP) and Monetary Policy (MP)was driven by this relationship between inflation and unemployment
LRAS Phillips Curve SRAS . Price Level Inflation . B . PL1 A PL* AD1 C PL2 AD SRPC AD FE RDP2 RGDP1 Unemployment Real GDP RGDP* If Unemployment was the problem then policy makers (FP and MP) INCREASED AD to DECREASE unemployment, but this tended to create INFLATION….
LRAS Phillips Curve SRAS . Price Level Inflation . B . PL1 A PL* AD1 C PL2 AD SRPC AD FE RDP2 RGDP1 Unemployment Real GDP RGDP* Or…If Inflation was the problem then policy makers (FP and MP) DECREASED AD to DECREASE Inflation, but this tended to create Unemployment….tackling the “evil” of the Day tended to make the other “evil” worse…
LRAS Phillips Curve SRAS . . Price Level Inflation . B . PL1 A PL* AD1 C PL2 AD SRPC AD FE RDP2 RGDP1 Unemployment Real GDP RGDP* Let’s look at Point “A” on the SRPC---Notice it corresponds with the PL* and FE GDP* Which also represents the economy at is normal Long Run Equilibrium State…Remember-LRAS represents POTENTIAL, LONG TERM RGDP. At FE RGDP the unemployment rate is the Natural Rate of Unemployment. In the LONG RUN no matter how much AD increases will ALWAYS Come up against the “wall of LRAS” —NO MATTER WHAT THE PRICE LEVEL IS!!
LRAS Phillips Curve SRAS . . Price Level Inflation . B . PL1 A PL* AD1 C PL2 AD SRPC AD FE RDP2 RGDP1 Unemployment Real GDP RGDP* So…if in the LONG RUN the Unemployment Rate stays at the Natural Rate of Unemployment REGARDLESS of the PRICE LEVEL, what to you think the LONG RUN PHILLIPS CURVE is going To look like??
Phillips Curve . LRPC 10% . Inflation B . A C SRPC 0% NRU 10% (5%) Unemployment The LONG RUN PHILLIPS CURVE (LRPC) is VERTICAL at the Natural Rate of Unemployment!! NO MATTER WHAT THE INFLATION RATE IS THE NRU STAYS THE SAME..
LRAS Phillips Curve SRAS LRPC . Price Level Inflation . . B . A B π* PL* C AD SRPC NRU FE Unemployment RGDP* Real GDP IMPORTANT: Point “A” on the Phillips Curve represents the LONG RUN situation where INFLATION Is going to be stable at NRU (roughly 5%) AND Point “B” on the AD/AS graph represents the LONG RUN situation where AD = SRAS = LRAS (Long Run Equilibrium). Embedded in the concept of FE RGDP is the Unemployment rate is at it’s Natural Rate (roughly 5%).
LRAS Phillips Curve SRAS LRPC . Price Level Inflation . B . A B A π* PL* C AD SRPC NRU FE Unemployment RGDP* Real GDP IMPORTANT: The Long Run Phillips Curve is NOT the same thing as the LRAS!!! The ONLY thing They have in common is (LRPC Explicitly and LRAS Implicitly) is the Natural Rate of Unemployment. The LRAS can shift without causing the NRU to change AND/OR the LRPC can shift without the LRAS curve shifting….GOT THAT…?
What SHIFTS the SRPC and the LRPC? • The SRPC and LRPC are not static, they can shift left or right. • SRPC is MARRIED to the SRAS curve on our AD/AS Model of the Economy • WHATEVER shifts the SRAS curve causes the SRPC to shift as well. • However they shift in OPPOSITE directions!!!
Phillips Curve LRAS SRAS SRAS1 Price Level Inflation . PL1 A π* PL* AD SRPC NRU RGDP1 FE Real GDP Unemployment RGDP* IMPORTANT: Lets assume the Economy experiences a NEGATIVE Supply Shock…We know this is going to cause the SRAS curve to shift to the LEFT (“STAGFLATION”)
Phillips Curve LRAS SRAS SRAS1 . Price Level Inflation . PL1 A π* PL* SRPC1 AD SRPC* NRU RGDP1 FE Real GDP Unemployment RGDP* Look at our new equilibrium point on the AD/AS graph (red dot). At this new equilibrium point If AD increased or decreased it would do so at an inflation rate HIGHER relative to the previous Equilibrium point at ANY point on the new SRAS curve. On the Phillips Curve graph NOW at any unemployment rate the inflation rate is going to be HIGHER relative to SRPC* …The SHORT RUN PHILLIPS CURVE shifts to the RIGHT!! Hint: SRAS shifts LEFT, SRPC shifts RIGHT.
Phillips Curve LRAS SRAS SRAS1 . Price Level Inflation . PL1 A π* PL* SRPC1 AD SRPC* NRU RGDP1 FE Real GDP Unemployment RGDP* Look at our new equilibrium point on the AD/AS graph (red dot). At this new equilibrium point If AD increased or decreased it would do so at an inflation rate HIGHER relative to the previous Equilibrium point at ANY point on the new SRAS curve. On the Phillips Curve graph NOW at any unemployment rate the inflation rate is going to be HIGHER relative to SRPC* …The SHORT RUN PHILLIPS CURVE shifts to the RIGHT!! Hint: SRAS shifts LEFT, SRPC shifts RIGHT.
Short Run Phillips Curve • What do you think is going to happen to the SRPC in the event of a POSITIVE SUPPLY SHOCK??? • SRAS curve shifts to the RIGHT and SRPC shifts to the LEFT!!!!
Phillips Curve • IMPORTANT: Whenever causes the short run AS curve to shift INDEPENDENT of the LRAS curve is going to cause the Phillips Curve to shift as well. • SRAS shifts RIGHT (positive supply shock) then the SRPC is going to shift to the LEFT • SRAS shifts LEFT (negative supply shock) then the SRPC is going to shift to the RIGHT.
LONG RUN PHILLIPS CURVE • What shifts the LONG RUN PHILLIPS CURVE? • Changes in government benefits to the unemployed/underemployed • Changes in the composition of the Labor force • Changes in Supply-Side policies
Phillips Curve LRPC LRPC1 10% Inflation SRPC 0% NRU1 (7%) NRU 10% (5%) Unemployment Changes in Govt Benefits towards the UNEMPLOYED and the UNDEREMPLOYED If the Govt. INCREASES the benefits they pay to the unemployed/underemployed in general this produces a higher level of FRICTIONAL unemployment. People tend to stay Unemployed for longer periods of time because the replacement income they receive from the govt. is closer to their lost income…In other words, the incentive to look for a Job is diminished and the tendency to stay unemployed increases.. The LONG RUN PHILLIPS CURVE SHIFTS TO THE RIGHT
Phillips Curve LRPC1 LRPC 10% Inflation SRPC 0% NRU1 (3%) NRU 10% (5%) Unemployment Changes in Govt Benefits towards the UNEMPLOYED and the UNDEREMPLOYED If the Govt. DECREASES the benefits they pay to the unemployed/underemployed in general this produces a lower level of FRICTIONAL unemployment. People tend to stay Unemployed for shorter periods of time because the replacement income they receive from the govt. is much LESS then their original income…In other words, the incentive to look for a job is INCREASES and the tendency to stay unemployed DECREASES... The LONG RUN PHILLIPS CURVE SHIFTS TO THE LEFT
Why do some other major economies have persistently higher unemployment rates than the U.S. • Government policies are a major culprit
Phillips Curve and The short and long terms effects of inflaton. • We will use as an example a sub-topic from the #1 FRQ from the 2009 AP Macroeconomics Test
LRAS Price Level SRAS LRPC INFLATION PL* AD* 6% RGDP* RGDP SRPC NRU UNEMPLOYMENT The INFLATION RATE currently is 6% and the Federal Reserve believes that is too HIGH. They decide to target 3% as a “preferred” level of Inflation.
Price Level SRAS LRPC INFLATION PL* AD* 6% RGDP* RGDP SRPC NRU UNEMPLOYMENT In order to DECREASE INFLATION the Federal Reserve would carry out the Open Market Operation or SELLING BONDS---this will DECREASE the Money Supply and INCREASE the FEDERAL FUNDS RATE and tend to INCREASE INTEREST RATES throughout the Financial System.
Price Level SRAS LRPC INFLATION PL* PL1 AD* 6% AD1 RGDP1 RGDP* RGDP SRPC NRU UNEMPLOYMENT INCREASING INTEREST RATES will cause AD to DECREASE
Price Level SRAS LRPC INFLATION PL* PL1 AD* 6% AD1 RGDP1 RGDP* RGDP SRPC NRU UNEMPLOYMENT REAL GDP will DECREASE AND PRICE LEVEL (inflation) will DECREASE AND Because RGDP DECREASES, UNEMPLOYMENT will INCREASE
Price Level SRAS LRPC INFLATION PL* PL1 AD* 6% AD1 RGDP1 RGDP* RGDP 3% SRPC NRU UR1 UNEMPLOYMENT INFLATION is DECREASING and UMEPLOYMENT IS INCREASING---There is MOVEMENT ALONG THE PHILLIPS CURVE IN THE SHORT RUN
Price Level SRAS LRPC INFLATION PL* PL1 AD* 6% AD1 RGDP1 RGDP* RGDP 3% SRPC NRU UR1 UNEMPLOYMENT The Economy settles at a LOWER INFLATION RATE and a HIGHER UNEMPLOYMENT RATE…
Price Level SRAS LRPC INFLATION PL* PL1 AD* 6% AD1 RGDP1 RGDP* RGDP 3% SRPC NRU UR1 UNEMPLOYMENT NOTE: This is the situation in the “SHORT-RUN”---What is the LONG-TERM EFFECT of the Federal Reserves action?
Price Level SRAS LRPC INFLATION PL* PL1 AD* 6% AD1 RGDP1 RGDP* RGDP 3% SRPC NRU UR1 UNEMPLOYMENT People (and business and govt) EXPECTIONS about INFLATION are now going to Be “built-in”---They have expectations of LOWER PRICES AND WAGES….
Price Level SRAS LRPC INFLATION PL* PL1 AD* 6% AD1 RGDP1 RGDP* RGDP 3% SRPC NRU UR1 UNEMPLOYMENT This will affect a number of things BUT lets focus on WAGES
Price Level SRAS LRPC INFLATION PL* PL1 AD* 6% AD1 RGDP1 RGDP* RGDP 3% SRPC NRU UR1 UNEMPLOYMENT Because there are expectations of LOWER Inflation then WAGES tend to Stabilize and MAY decrease (assume this to be the case)…On the AD/AS Graph, which curve is going to be affected???
SRAS Price Level SRAS1 LRPC INFLATION PL* PL1 AD* PL2 6% AD1 RGDP1 RGDP* RGDP2 RGDP 3% SRPC NRU UR1 UNEMPLOYMENT Aggregate Supply!! Cost of Production will tend to DECREASE…When C.O.P DECREASES then Aggregate Supply will INCREASE (Shift to the Right)
SRAS Price Level SRAS1 LRPC INFLATION PL* PL1 AD* PL2 6% AD1 RGDP1 RGDP* RGDP2 RGDP 3% SRPC NRU UR1 UNEMPLOYMENT Price Level (inflation) has DECREASED and RGDP has INCREASED (back to the original FE FGDP* therefore UNEMPLOYMENT has DECREASED.
SRAS Price Level SRAS1 LRPC INFLATION PL* PL1 AD* PL2 6% AD1 RGDP1 RGDP* RGDP2 RGDP 3% SRPC NRU UR1 UNEMPLOYMENT How does this affect the Phillips Curve??? When the SRAS curve shifts to the RIGHT The Short-Run Phillips Curve shifts to the LEFT!! Now at every level of UNEMPLOYMENT the PRICE LEVEL will be LOWER.
SRAS Price Level SRAS1 LRPC INFLATION PL* PL1 AD* PL2 6% AD1 RGDP1 RGDP* RGDP2 RGDP 3% Economy is BACK to FE where AD = SRAS=LRAS We are STILL at the NRU but at a LOWER I INFLATION RATE!! SRPC NRU UR1 UNEMPLOYMENT With the shift of The Short Run Phillips Curve we move back to Long-Run Equilibrium where SRPC intersect LRPC at the NRU….THE LONG RUN PHILLIPS CURVE IS NOT GOING TO SHIFT.