Download
1 / 23
250 likes | 764 Vues
ADAS and Phillips Curve. AD/SRAS overview. Aggregate Demand Total spending on goods and services in the economy. A change in C, I, G, or Xn causes a change in AD PL and output (y) are changed by a change in AD Short Run Aggregate Supply

E N D
AD/SRAS overview • Aggregate Demand • Total spending on goods and services in the economy. • A change in C, I, G, or Xn causes a change in AD • PL and output (y) are changed by a change in AD • Short Run Aggregate Supply • Total amount of goods and services produced in the economy. • A change in input prices, productivity and government policies change SRAS • PL and output(y) are changed when SRAS changes.
Economic Conditions AD/AS at Full Employment LRAS LRAS LRAS LRAS SRAS Price Level Price Level Price Level Price Level AD/AS with high inflation AD/AS in Recession AD/AS with Stagflation SRAS SRAS SRAS AD PL PL PL AD AD AD PL GDPR GDPR YF YF YF YF Y1 Y1 Y1 GDPR GDPR
Changes in AD/SRAS… You tell me what changes and what happens to PL and output • The government spends money national defense • The price of oil rises • There is a fall in consumer confidence • Argentina buys more of US made goods • The government increases regulation • Interest rates increase • Wages decrease • Expansionary monetary policy • The government gives subsidies to businesses ↑ AD, ↑ PL, ↑Y ↓ SRAS, ↑ PL, ↓ Y ↓ AD, ↓ PL, ↓Y ↑ AD, ↑ PL, ↑Y ↓ SRAS, ↑ PL, ↓ Y ↓ AD, ↓ PL, ↓Y ↑ SRAS, ↓PL, ↑ Y ↑ Sm, ↑ irN , ↑ AD, ↑ PL, ↑Y ↑ SRAS, ↓PL, ↑ Y
EFFECTS OF AD CHANGES? LRAS LRAS PL PL SRAS SRAS PL2 PL1 PL1 PL2 AD2 AD1 AD1 AD2 YF Y2 GDPR Y2 YF GDPR AD ____ PL ____ Unemployment AD ____ PL ____ Unemployment Trade-off! Relationship Between PL and Unemployment: (in the short run) Click the mouse once to fill in the blanks.
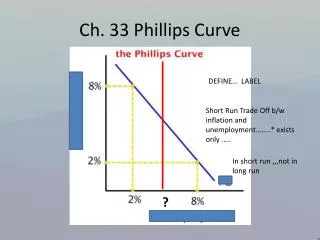
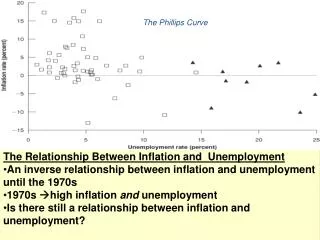
Key Idea: • In the short run there is a TRADE-OFF between INFLATION and UNEMPLOYMENT. • To reduce unemployment – inflation occurs • To reduce inflation --- unemployment increases • Research by a Kiwi (New Zealand) economist named Williams Phillips documented this relationship in 1958 by studying the UK from 1861-1958 . As a result a new model was developed to illustrate the trade-off: The Short Run Phillips Curve
The Short Run Phillips Curve Inflation Rate Inflation Rate %1 %2 %2 %1 SRPC SRPC U1 U2 Unemployment Rate U2 U1 Unemployment Rate Inflation rate unemployment rate Inflation rate ↓ unemployment rate Due to the trade-off (inverse relationship), what is the shape of the SRPC? Downward-sloping!
Goal Address the problem without creating a worse problem – limit the negative effects. • When stagflation first occurred in the 1970s due to a supply-side shock ( price of oil/energy), it created a new dilemma for policymakers and called into question the credibility of the short run Phillips Curve (SRPC) relationship.
Stagflation: ???? LRAS SRAS2 Does stagflation negatethe SRPC trade-off between inflation and unemployment? Some economists rejected the SRPC relationship; others found an alternative explanation. PL SRAS1 PL2 PL1 It appears to negate the inverse relationship. Both PL and unemployment increase! AD Y2 YF GDPR SRAS ____ PL ____ Unemployment
Stagflation and the SRPC Inflation Rate Inflation Rate % %2 SRPC2 SRPC2 %1 SRPC1 SRPC1 Unemployment Rate U U1 U2 Unemployment Rate Explanation: Stagflation simply caused the SRPC to shift to the right --- indicating that for each level of unemployment, there is a higher rate of inflation; for each inflation rate, there is a higher level of unemployment.
What about an increase in SRAS? LRAS Inflation Rate PL For each level of inflation, a lower level of unemploy- ment exists. SRAS1 SRAS2 Shift Left %1 %2 PL1 PL2 SRPC1 SRPC2 AD Unemployment Rate U YF Y2 GDPR For each level of unemployment, a lower level of inflation exists. SRAS ____ PL ____ Unemployment
Increase in AD → movement along Phillips Curve LRAS Price Level SRAS LRPC Inflation Rate PL AD B PL2 B %B YF A A %A AD2 SRPC NRU Unemployment Rate NRU GDPR
Shift in SRAS→ Shift in SRPC LRAS Price Level SRAS LRPC Inflation Rate PL AD SRAS2 YF A A %A B PL2 %B B SRPC SRPC2 Unemployment Rate NRU GDPR
Practice Problems • A short Run Phillips Curve shows an inverse relationship between • Interest rates and borrowing • Inflation and unemployment • Income and consumption • Prices and quantity demanded • Inputs and outputs
Practice Problems • Stagflation is most likely to be caused by • An increase in AD • A decrease in AD • An increase in AS • A decrease in AS • A large increase in the money supply
Practice Problems • An increase in personal income taxes will most likely cause AD and AS to change in which of the following ways in the short run? AD AS • Not change Decrease • Not change Increase • Decrease Not Change • Decrease Increase • Increase Not Change
Practice Problems • When firms restructure their operations to decrease production cost, the AS, PL and real output will change in which of the following ways? AS PL Output • Shift left Increase Increase • Shift left Increase No Change • Shift right Increase Increase • Shift right Decrease Increase • Shift right Decrease Decrease
Practice Problems • When an economy is at full employment, which of the following will most likely create demand pull inflation in the short run? • Increase in the discount rate • An increase in personal income taxes • A decrease in the real rate of interest • A decrease in government spending • A decrease in the money supply
Practice Problems • An increase in AD will cause which of the following? • A movement along a given SRPC • The LRPC to become horizontal • An increase in the natural rate of unemployment • A decrease in the capital stock • A decrease in the expected price level
Practice Problems • Which of the following would cause the SRAS to shift to the right? • An increase in the age rate • An increase in the interest rate • An increase in the natural rate of unemployment • A decrease in capital stock • A decrease in the expected price level
Assume that the United States economy is currently in a recession in a short-run equilibrium. • Draw a correctly labeled graph of the short-run and long-run Phillips curves. Use the letter A to label a point that could represent the current state of the economy in recession. • (b) Draw a correctly labeled graph of aggregate demand and aggregate supply in the recession and show each of the following. • The long-run equilibrium output, labeled Yf • The current equilibrium output and price levels, labeled Ye and PLe, respectively • To balance the federal budget, suppose that the government decides to raise income taxes while maintaining the current level of government spending. On the graph drawn in part (b), show the effect of the increase in taxes. Label the new equilibrium output and price levels Y2 and PL2, respectively. • Assume that the Federal Reserve uses monetary policy to stimulate the economy. • What open-market policy should the Federal Reserve implement? • Using a correctly labeled graph of the money market, show how the policy in part (d)(i) affects nominal interest rates. • What will be the impact of the policy on the price level? Explain. • Now assume instead that the government and the Federal Reserve take no policy action in response to the recession. • In the long run, will the short-run aggregate supply increase, decrease, or remain unchanged? Explain. • In the long run, what will happen to the natural rate of unemployment?
The unemployment rate in the country of Southland is greater than the natural rate of unemployment. • Using a correctly labeled graph of aggregate demand and aggregate supply, show the current equilibrium real gross domestic product, labeled YC, and price level in Southland, labeled PLC. The president of Southland is receiving advice from two economic advisers—Kohelis and Raymond—about how best to reduce unemployment in Southland. • Kohelis advises the president to decrease personal income taxes. • How would such a decrease in taxes affect aggregate demand? Explain. • Using a correctly labeled graph of the short-run Phillips curve, show the effect of the decrease in taxes. Label the initial equilibrium from part (a) as point A, and the new equilibrium resulting from the decrease in taxes as point B. • Raymond advises the president to take no policy action. • What will happen to the short-run aggregate supply curve in the long run? Explain. • Using a new correctly labeled graph of the short-run Phillips curve, show the effect of the change in the short-run aggregate supply you identified in part (c)(i).
Assume that a country’s economy is in equilibrium. • Using a correctly labeled ADAS graph, show how an increase in the price of oil, an important resource will affect the price level and output in the short run. • Using a correctly labeled graph, who how the increase in the price of oil affects the short run phillips curve. • Assume that the central bank responds to the higher price of oil by increasing the money supply. • Explain the process by which the increase in the money supply will affect the AD in the short run. • Indicate how the increase in the money supply will affect real output and price level. • Now assume instead of using monetary policy in response to the oil price increase, the government reduces business taxes, which result in lower production cost. Using a new correctly labeled graph, who the effect of the reduction in business taxes on the PL and output in the short run.