Download
1 / 38
390 likes | 455 Vues
Learn about how changes in exchange rates and factors like consumer wealth, taxes, and foreign income affect the equilibrium level of output in an open economy. Explore determinants of the current account and aggregate supply dynamics.

E N D
CHAPTER 16 Output and the Exchange Rate in the Short Run
Chapter Organization • Aggregate Demand and Aggregate Supply: A Review • Determinants of the Current Account • Exchange-Rate Changes and Equilibrium Output in an Open Economy • Changes in the Exchange Rate and the Composition of Output
AD and AS: A Review • Aggregate Demand (AD): • slopes downward – as price level declines, quantity of goods demanded increases. • Note well that P is not an opportunity cost. It’s an index. • Downward slope has NOTHING to do with income or substitution effects.
AD and AS: A Review So why is AD negatively sloped? • Wealth Effect:Increase in price level: • Reduces value of accumulated financial assets. • Consumers reduce consumption of goods. • Aggregate quantity demanded changes. • Interest-Rate Effect (frankly... it’s debatable): • Pi, based on money market • Lower business investment • Lower consumer spending on housing and cars • Aggregate quantity demanded falls • International Substitution Effect: • Price of domestic goods relative to foreign goods. • Foreign demand (exports) for domestic goods . • Domestic demand (imports) for foreign goods . • Aggregate quantity demanded .
Price Level (P) B P1 Aggregate Demand A P0 Y1 Y0 Real GDP (Y) AD and AS: A Review Figure 16.1: The Aggregate Demand Curve
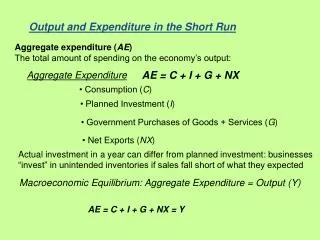
AD and AS: A Review • Change in Aggregate Demand: • A shift of the AD curve • () in the AD will shift the curve to the right (left). • New AD curve shows that at any given price level, society wants to buy more (less) goods/services. • Expenditure approach to calculating GDP • 4 sectors in an open economy that buy real goods/services GDP = C + I + G + (X – M) Changes in any above factors shifts AD
Price Level (P) AD1 Aggregate Demand (AD) AD2 Real GDP (Y) AD and AS: A Review Figure 16.2: Changes in Aggregate Demand
AD and AS: A Review Consumption (C): • Consumer wealth • Consumer expectations • consumer indebtedness • Taxes
AD and AS: A Review Investment spending (I) • Interest rates • Expectations of future economic conditions • Taxes
AD and AS: A Review Government Spending (G)
AD and AS: A Review Exports (X) and Imports (M) Exports • changes in income of foreign countries • Movements in the real exchange rate Imports • changes in domestic income • Movements in the real exchange rate
AD and AS: A Review • Aggregate Supply (AS): • Slopes upward to the right
AD and AS: A Review • Why is AS positively sloped? • As output expands, prices of inputs rise before economy reaches full employment leading to rising unit costs. • As some prices rise while others are constant, price level on average before reaching full employment. • Most important price in economy is price of labor • Hiring more labor K/L ratio. • MPL and wage rate . • Leads to rising production costs
Price Level (P) Aggregate Supply P1 B P0 A Y0 Y1 Real GDP (Y) AD and AS: A Review Figure 16.3: The Aggregate Supply Curve
Price Level (P) AS2 Aggregate Supply AS1 Real GDP (Y) AD and AS: A Review Table 16.4: Changes in Aggregate Supply
AD and AS: A Review Changes in Aggregate Supply: • Changes in potential real GDP (Growth!) • Factors of production • Productivity of factors of production • Input prices • Exchange-rate shock • Taxes • Public’s expectations
AD and AS: A Review Public’s inflationary expectations • Perceived increases in future inflation cause adjustments in economic action today. • Producers may attempt to increase prices today to stay ahead of anticipated inflation. • Workers attempt to receive larger salary increases today to protect real wages and standards of living. • Aggregate supply curve will decrease (left shift).
AD and AS: A Review • Aggregate Equilibrium • Intersection of AS and AD determines the open economy’s equilibrium
Price Level (P) Aggregate Supply E Pe Aggregate Demand Ye Real GDP (Y) AD and AS: A Review Figure 16.6: The Equilibrium Price Level and Equilibrium real Output (GDP)
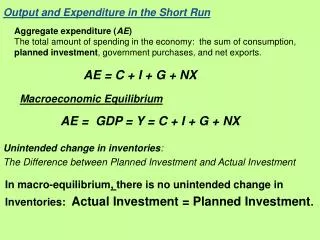
Determinants of the Current Account • Changes in AD and AS influence output • How does a change in the current account (exports minus imports) impact the equilibrium level of output? • We will focus on one component of aggregate demand and supply – the current account. • Changes in other determinants of AD and AS will be ignored.
Determinants of the Current Account Changes in current account: Exports Exports change with changes in foreign income, Yf Size of change determined by: • Size of change in foreign income • Elasticity
Determinants of the Current Account Income elasticity of demand for the country’s exports: • Percentage change in a country’s exports relative to the percentage change in foreign income • Size of country’s foreign income elasticity depends on product mix of a country’s exports.
Determinants of the Current Account Real exchange rate (RXR) • As real value of country’s currency appreciates (depreciates), level of a country’s exports () • Size of effect depends on • Size of change in real exchange rate (Larger change in RXR, larger effect on exports) • Price elasticity of demand for exports: (The responsiveness of exports to changes in the real exchange rate.)
Determinants of the Current Account Imports Level of domestic income (Yd) • As domestic income rises, level of imports rises. • Size of effect depends on two factors • Size of change in domestic income • Income elasticity of demand for imports:
Determinants of the Current Account Real Exchange rate • As currency appreciates, imports increase • Magnitude of effect depends on two factors • Size of change in the real exchange rate • Price Elasticity of Demand for Imports:
Exchange-Rate Changes and Equilibrium Output in an Open Economy • Effects on open economy • AD is link between current account balance and output. • Since real exchange rates affect current account, we can link them to changes in domestic output.
Exchange-Rate Changes and Equilibrium Output in an Open Economy Exchange-Rate Appreciation • Equilibrium exchange rate equates inflows and outflows of foreign exchange at XRe. • Assume rate is associated with purchasing power parity (PPP).
Exchange-Rate Changes and Equilibrium Output in an Open Economy Say currency appreciates to XR1 • Assume caused by rightward shift of supply of foreign exchange • Exports would fall and imports would rise resulting in a current account deficit. • Equal to difference between M and X
Supply of Foreign Exchange (S) S1 E XRe X M XR1 Demand for Foreign Exchange (D) FX1 FXe Exchange-Rate Changes and Equilibrium Output in an Open Economy Figure 16.7: The Exchange Rate and Equilibrium Output Panel A Price Level (P) Foreign Exchange
Exchange-Rate Changes and Equilibrium Output in an Open Economy Effects of current account deficit on real economy • Domestic economy’s AD will decrease as exports fall and imports rise • AD shifts to left • Equilibrium level of output (real GDP) falls. • Price level falls as AD decreases. • Price of imports falls. • Price of US produced goods that compete with imports may fall.
Price Level (P) Aggregate Supply (AS) F Pe G P1 Aggregate Demand (AD) AD1 Real GDP (Y) Y1 Ye Exchange-Rate Changes and Equilibrium Output in an Open Economy Figure 16.7: The Exchange Rate and Equilibrium Output Panel B
Exchange-Rate Changes and Equilibrium Output in an Open Economy Exchange-Rate Shocks • Assume a large depreciation of a country’s currency in one week • Demand for foreign exchange has increased and supply has decreased. • Exchange rate goes from XRe to XR’’. • Could have been capital flight out of country due to domestic crisis or due to exchange rate being fixed at inappropriate level for long period of time.
Exchange Rate (XR) Aggregate Supply (AS) S” XR3 F E XRe D” Aggregate Demand (AD) Foreign Exchange (FX) XRe Exchange-Rate Changes and Equilibrium Output in an Open Economy Figure 16.11: The Effect of a Major Devaluation Panel A
Exchange-Rate Changes and Equilibrium Output in an Open Economy • If depreciation is large, effects on AS can be very large as well. • For an open economy, depreciation causes a large short-run increase in the cost of production. • AS shifts left, decreasing output significantly leading to recession. • Price level increases significantly. • Common for developing countries
Price Level (P) Aggregate Supply (AS) AS” P3 H E Pe Aggregate Demand (AD) Real GDP (Y) Y3 Ye Exchange-Rate Changes and Equilibrium Output in an Open Economy Figure 16.11: The Effect of a Major Devaluation Panel B
Changes in the Exchange Rate and the Composition of Output • Effects on Composition of Output • How does the composition of output change in the long run due to changes in the exchange rate? • Distinction betweenTradable and Non-tradable goods
Changes in the Exchange Rate and the Composition of Output • Assume currency appreciates • Open economy’s equilibrium output and price level change • Overall production of tradable goods falls. • Exports decline and imports rise. • Decline in price of tradable goods makes non-tradeable goods relatively more expensive. • Non-tradable industry: Resources will flow to industry with higher prices
Changes in the Exchange Rate and the Composition of Output • If operating at full employment, resources flow from sector that is declining to sector that is expanding. • Positive effect on economy’s non-tradable goods sector. • Occurred in U.S. in early 1980’s as economy shifted production away from tradable goods to non-tradable goods. • Opposite occurs when country’s currency depreciates.