Load Curves
Load Curves. Prof. Osama El Masry. ENERGY. Energy

Load Curves
E N D
Presentation Transcript
Load Curves Prof. Osama El Masry
ENERGY Energy • In electrical industry it is generally expressed as kilowatt hour (kWh). It is the amount of energy in spend in one hour. If one kilowatt electrical heater (which consumes one kilo-Joules per second) is turned for one hour it will consume one kWh. • In electrical industry it is commonly called unit. • Mechanical work done over a period of time is also a form of energy like heat.
ENERGY Work done • It is applied force times distance covered (N x m). Its unit is N.m. The thermal energy is also a form of work done. It's unit is Joules after the famous scientist Joule, who discovered that energy and work are equivalent. It is also at times expressed in the heat unit of calorie. • 1 calorie = 4.186 Joules • Electrical work is the product of voltage difference and the current that flows . Volt x Amp = watt = Joule/sec
Power plant terms Installed capacity • It is the designed power generation capacity of a plant. It is expressed in terms of energy generated per unit time. Megawatt electric (MW or MWe) is the most commonly used term for electricity generating plants. In case of process steam plant it is either expressed in amount of steam generated per unit time (t/h or kg/s) or in Megawatt thermal (MWth).
Power plant terms Power • It is the rate of work or work done per unit time. In the power industry it is generally expressed as Megajoules per second or MW. The basic unit is watt (Joules per second). Base load Plant • It is a type of plant which caters to a constant load demand. Such plants run 100% of the time. Nuclear and Coal fired plants are suitable for this Peak Load Plant • These plants helps tide over short term (15%) demand peak. Gas turbine, hydro plant can be used.
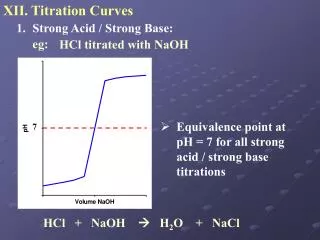
Efficiency Heat rate: • It is the amount of energy (kJ) that the fuel must supply to produce unit amount of electrical energy (kWh). It is expressed as kJ/kWh or kCal./ KWh or BTU/kWh. This represents the overall efficiency of a power plant. HR = (KJ fuel burnt/kWh electricity produced) • Turbine Heat rate: It is the amount of heat steam (kJ or BTU) must deliver to produce unit of heat (kWh). It gives the thermodynamic efficiency of the steam cycle, but it does not include the boiler efficiency.
Efficiency • Thermal efficiency It is the amount of heat carried by the steam per unit amount of heat delivered through the fuel. • Combustion efficiency It is the ratio of the amount of energy or heat released by the fuel and the energy contained in the fuel burnt
Load Distribution Unit 1 Unit 2 Unit 3 Unit 4 Generators Groups Customer 1 Customer 2 Customer …..
Load Distribution • Demand Factor (d)= < 1.0 • Group Capacity Factor (D)= >1.0 • Peak Diversity Factor (r)= >1.0
Information obtained from load curves: • Area under load curve = Units generated • Highest point of the curve = MD • (Area under curve) ÷ (by total hours) = Average load • (Area under load curve) ÷ (Area of rectangle containing load curve) = LF • Helps to select size & number of generating units. • Helps to create operating schedule of the power plant.
Example a)1000 apartments- connected load/apt= 4 kW For residential take: d= 0.45, D= 3.5, r=1.4 b) Other services For commercial take D=1.5, r = 1.1
Example (cont.) • For apts. Max. load= 1000 x 4 x 0.45 =1800 kW Required load = 1800/(3.5 x 1.4) = 367 kW • For Commercial Required load = 141.4/(1.5 x 1.1) = 85.7 kW Total Load = 367 + 85.7= 452.7 kW
Example 2 • Determine the maximum demand for the group of energy consumers shown in the table
PLANT CAPACITY Availability It is the fraction of the time a plant is available for generation. Sometimes a plant may be partially available due to lack of operation of some components of the plant. It is called partial availability. This term, however, is not very commonly used. Outage It is another term for shut down of the plant either for planned maintenance (Planned outage) or due to unforeseen break down (forced outage).
PLANT CAPACITY • Utilization factor It is the ratio of present maximum generation of the plant and the installed or the original design capacity of the plant. Utilization factor =( Maximum load)/(rated capacity of plant) • Capacity factor It is the ratio of total generation of the plant for a given period and that the plant is capable of delivering over the same period. Capacity Factor = (Average load)/(rated capacity of plant) • Average Load Average load = (Area under load curve)/(duration of the load curve)
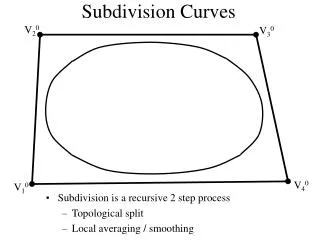
Load Duration Curve • Is a set of time series data such as hour-to-hour electric usage, sorted in a way so you can easily see how frequently values are very high or very low. A relatively flat duration curve means the values tend to fall within a small range.
How to Create a Load Duration Curve using a Spreadsheet • Collect a series of data, usually on a common interval like by hour, minute, or day. • Organize your time series data in a spreadsheet. In this simple example, begin by entering your time/date values in column A, and data values in column B. • In Column C, number the data values 1,2,3. . • (For example, for an annual set of hourly data, this will probably be 8,760)
How to Create a Load Duration Curve using a Spreadsheet • (For example, for an annual set of hourly data, this will probably be 8,760) • In Column D, calculate the % of time. • Copy the values from Column B into Column E. Then sort the values in column E only, in descending order.
How to Create a Load Duration Curve using a Spreadsheet Create a line chart where the %value (column D) represents the X axis, and the sorted values in column E represents the Y-axis series. format the chart and legend as desired.