Download
1 / 19
210 likes | 507 Vues
EDX-Spectra Simulation Optimization of Excitation Conditions and Detection Limit Calculations in EPMA F. Eggert, Röntgenanalytik Apparatebau GmbH, Berlin Introduction Theory of simulation complete spectra Applications of spectra simulation

E N D
EDX-Spectra Simulation • Optimization of Excitation Conditions and Detection Limit Calculationsin EPMA • F. Eggert, Röntgenanalytik Apparatebau GmbH, Berlin • Introduction • Theory of simulation complete spectra • Applications of spectra simulation • Determination of detection limits with spectra simulation • Summary
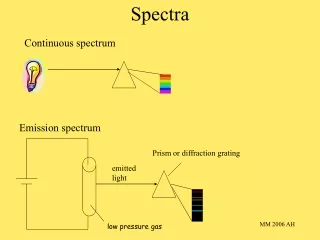
EDX – Spectra SimulationInroduction • Today the standardless evaluation of measured spectra is an established methodology in Electron Probe Microanalysis (EPMA) with Energy Dispersive Spectrometer (EDX) in Scanning Electron Microscope (SEM) • New developments offer the possibility to calculate complete spectra in dependence to analytical conditions (spectra simulation). • The basics are: • - Exact knowledge about all X-ray lines of elements and about other atomic data • - Knowledge about absolute cross-sections of both, the Characteristic X-rays and the Bremsstrahlung • - Calculation of excitation and absorption of X-rays in specimen and detector (characteristic radiation and Bremsstrahlung) • - Calculation of the entire Bremsstrahlung-deviation as the main background and simulation of other background components • - Simulation of detector-resolution influence and count-statistics to simulate realistic spectra • The content of presentation is to show the benefits of spectra simulation to daily analytical work with Electron Microscope and EDX. • Introduction
EDX – Spectra Simulation Basics • Theoryof Simulation • The ratio of emitted counts of characteristic X-ray quanta to the counts of emitted Bremsstrahlung-quanta with same energy (in an specified energy region) is known as P/B-ratio (or P/U in this equation). • Calculation of the Bremsstrahlung deviation for all spectra channels taking into account the self-absorption Albrand detector-absorption lin specimen. mass absorption coefficients (µ/) = f (Z , E) absorption jumps of (µ/) with energies EC X Lifshin empiric 2.parameters Kramers l is the index of current channel during spectra calculation
EDX – Spectra Simulation Basics • Theoryof Simulation + • All line- and shell- energies • Relative emission rates of a single shell • Excitation of sub-shells • Coster-Kronig transitions • Fluoresence yields Bremsstrahlung + Lines Escape + Artefacts (ICC) Count statistics (Noise) ____________________ = Simulated Spectrum (2000 cps, 3 minutes)
EDX – Spectra Simulation Basics To make the simulation possible, an atomic data library with fast access to all element specific data is necessary: • Atomic Data Library (Data Base) The accuracy of data base is crucially for quality of simulation!
EDX – Spectra Simulation Application • Optimization Before the Measurement: Eo 15 keV 20 keV 25 keV 30 keV
EDX – Spectra Simulation Application • Verification: Excitation of Lines (Eo) Excitation of Au-L lines (Sub-Shells !) with different Eo
EDX – Spectra Simulation Application • Optimization / Verification: Tilt-Angle AuAg-Alloy Eo: 15 keV tilt: -30o...+30o Simulation Absorption-Effects: - Irregular Surfaces - Rough Specimen - Particle
EDX – Spectra Simulation Application • Optimization: Influence of Detector-Resolution AuAg-Alloy: 125 eV vs. 165 eV
EDX – Spectra Simulation Application • Verification of Possible Overlap-Problems 5% Pd in Pb with/without Pd
EDX – Spectra Simulation Application • Element-Identification (Verification of Unknown Peaks) Si in Specimen ? ...with Escape ... without Escape No !
EDX – Spectra Simulation Application • Element-Identification (Comparison with Real Spectra) Spectrum with Ba ...measured spectrum ...simulated spectrum • Additional elements ? • Improve data-base ? Compare !
Teaching (Simulation of EDX X-Ray Acquisition Process) EDX – Spectra Simulation Application 15s Acq.time 2000 cps „Acquisition“ ready ...
EDX – Spectra Simulation Detection Limits • Calculation of Detection Limits • The question is, whether an element in specimen with expected concentration is detectable or not? • If an element is detectable... How are the optimal measurement and excitation conditions (SEM and spectrometer parameters) and how long does it take (acquisition time)? • The signal/background-ratio is the base for calculations of detection limits ( P/B-ratio) ... determination is possiblewith spectra-simulation ! Counts Counts Probability Probability Significance Level NS Detection Limit NDL
EDX – Spectra Simulation Detection Limits • Detection-Limit of an Element with Different Specimens MDL for Pd in Te M L K MDL for Pd in Au
EDX – Spectra Simulation Detection Limits • Detection-Limits with Varying Conditions Al in Cu M L K
EDX – Spectra Simulation Detection Limits • Simulation of Spectra-Acquisition Near Detection-Limits MDL = 0.2 % • Significant element presence ! • Concentration below the detection-limit ! • Is it really possible ... ? Yes You had luck ! Al: 0.15 % Al: 0.3 % #1 #2 #3 Al: 1 %
EDX – Spectra Simulation Detection Limits • Simulation of Spectra Acquisition / Detection Limit = f (time) 5 s: MDL = 1.8% 10 s: MDL = 1.3% 20 s: MDL = 0.9 % detectable ! 50 s: MDL = 0.6 % 100 s: MDL = 0.4 % 2000 cps 1% Zr in Sn ?
EDX – Spectra Simulation Summary • It is possible to calculate the entire EDX-spectrum with a standardless EPMA-correction model taking into account all effects of specimen- and detector-interaction. • Spectra simlation is useful for a better understanding and interpretation of measured spectra. • With spectra simulation all complex effects of excitation, absorption and detection are shown very descriptive and didactically (teaching, coaching, …) • The simulation of several excitation situations gives the possibility to optimize all conditions even before the actual specimen maesurement and data acquisition. • With spectra simulation the analyst is able to make estimations for detection limits. • Effects of counting-statistics are possible to verify. • Future View: • Application of spectra simulation for interactive qualitative analysis • (displacement of simple line-mark identification) • Calculation of entire spectrum for a visual comparison after quantitative evaluation (reconstruction) for an improvement of final result-reliabilities