Age-Related Analysis of Glc4 Concentration in Urine: Controls vs. Pompe Disease Patients
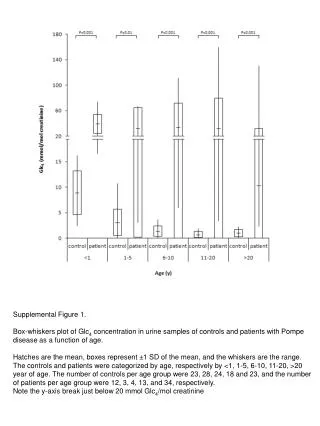
This study presents a box-whisker plot illustrating the concentration of Glc4 in urine samples from both healthy controls and patients diagnosed with Pompe disease, categorized by age groups (20 years). The mean values are indicated by hatches, while the boxes represent ±1 standard deviation, and the whiskers show the range of data. Sample sizes for age groups are as follows: controls (23, 28, 24, 18, 23) and patients (12, 3, 4, 13, 34). An important note is the y-axis break just below 20 mmol Glc4/mol creatinine.

Age-Related Analysis of Glc4 Concentration in Urine: Controls vs. Pompe Disease Patients
E N D
Presentation Transcript
Supplemental Figure 1. Box-whiskers plot of Glc4 concentration in urine samples of controls and patients with Pompe disease as a function of age. Hatches are the mean, boxes represent ±1 SD of the mean, and the whiskers are the range. The controls and patients were categorized by age, respectively by <1, 1-5, 6-10, 11-20, >20 year of age. The number of controls per age group were 23, 28, 24, 18 and 23, and the number of patients per age group were 12, 3, 4, 13, and 34, respectively. Note the y-axis break just below 20 mmol Glc4/mol creatinine