Download
1 / 29
290 likes | 551 Vues
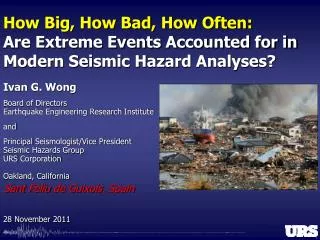
How Big, How Bad, How Often: Are Extreme Events Accounted for in Modern Seismic Hazard Analyses?. Ivan G. Wong Board of Directors Earthquake Engineering Research Institute and Principal Seismologist/Vice President Seismic Hazards Group URS Corporation Oakland, California 28 November 2011.

E N D
How Big, How Bad, How Often: Are Extreme Events Accounted for in Modern Seismic Hazard Analyses? Ivan G. Wong Board of DirectorsEarthquake Engineering Research Institute and Principal Seismologist/Vice PresidentSeismic Hazards GroupURS Corporation Oakland, California 28 November 2011 SantFeliu de Guixois, Spain
Introduction • The 2004 moment magnitude (M) 9.2 Sumatra and 2011 M 9.0 Tohoku, Japan earthquakes can be regarded as “extreme” events because in the past 200 years, less than 10 earthquakes have reached M 9.0 or greater. • Both earthquakes can also be regarded as extreme events because of the devastating loss of life. • However, the 2010 M 7.0 Haiti earthquake is also an extreme event because possibly many more than 100,000 deaths occurredeven though it was of moderate size.
Introduction (cont.) • Thus earthquakes can be extreme either because of the resulting hazard (e.g., ground shaking, tsunami) or the resulting losses or both. It is important to distinguish between hazard and losses/damage when defining extreme events. • So the question of how big, how bad, and how often must be asked in the context of hazard and risk analyses.
Types of Seismic Hazards Primary • Strong Ground Shaking • Surface Faulting • Subsidence/Uplift Secondary • Ground Failure • Liquefaction • Landslides • Tsunamis/Seiches
Hazard Versus Risk • HAZARD = Consequence of a natural event • RISK = The probability of exceeding some loss or damage • LOSS/DAMAGE = Hazard x Population/Inventory x Vulnerability • High risk, low hazard.
26 December 2004 Sumatra-Andaman Earthquake • > 200,000 maybe 300,000 deaths • At least 16 countries impacted by tsunami • Losses difficult to estimate because of general third-world rural conditions • Limited historical record did not suggest such an earthquake was possible.
12 January 2010 M 7.0 Haiti Earthquake • 316,000 deaths (toll highly uncertain; could be as low as 100,000) • 300,000 injured • 1.3 million displaced • 97,000 houses destroyed and 188,000 damaged • Port-au-Prince was destroyed in previous earthquakes e.g., 1750
11 March 2011 M 9.0 Tohoku-Oki, Japan Earthquake • > 16,000 casualties (> 90% drowned) • > 12,000 missing • > 5,000 injuries • 190,000 buildings damaged or destroyed • 4.4 million households without electricity • 3 nuclear reactors damaged • $122 - $235 billion direct economic loss • > $300 billion estimated indirect economic loss
Probabilistic Seismic Hazard Analysis • The objective of PSHA is to answer the questions: How big, how bad, and how often? • The latter can only be answered if the frequency of earthquake occurrence is an input into the analysis. • This type of seismic hazard analysis is in contrast to a deterministic (scenario) analysis where the earthquake rates are not considered. Sometimes erroneously called a worse-case scenario analysis. • Probabilistic hazard can be for ground shaking, tsunami inundation, fault displacement, slope failure, or liquefaction.
PSHA • Objective is to estimate the probability that a specified level of hazard will be exceeded. • That probability can be on an annual basis or for building codes expressed as 10% probability of exceedance in 50 years (475-year return period). • Integrates hazard from all significant seismic sources. • Incorporates the frequency of earthquakes for each seismic source. • Allows for explicit treatment of uncertainty. • Provides the basis for making decisions based on risk.
PSHA • PSHA has become an increasingly important tool for aiding design and decision-making at all levels in both the private sector and government. • The level of sophistication applied to PSHA has increased dramatically over the past three decades since the technique was first introduced. • As PSHA was implemented more and more in different forms in the U.S., it became clear that it was time to establish more uniform and up-to-date guidelines for future studies.
Senior Seismic Hazard Analysis Committee Guidelines • In the U.S., guidelines have been established for the proper performance of PSHAs for critical facilities. • The guidelines stress the importance of (1) proper and full incorporation of uncertainties and (2) inclusion of the range of diverse technical interpretations that are supported by data. • I would suggest that the Tohoku-Oki earthquake would have been considered in PSHAs in Japan if the philosophy behind these guidelines had been followed. Hanks et al., 2009
SSHAC(continued) • The most important and fundamental fact that must be understood about a PSHA is that its objectivecan be attained only with significant uncertainty. • SSHAC believes that the following should be sought in a properly executed PSHA project for a given difficult technical issue: • A representation of the legitimate range of technically supportable interpretations among the entire informed technical community, and • The relative importance or credibility that should be given to the differing hypotheses across that range. Hanks et al., 2009
Consensus • SSHAC identifies there are different types of consensus, and then concludes that one key source of difficulty is failure to recognize that • There is not likely to be "consensus" (as the word is commonly understood) among the various experts; and • No single interpretation concerning a complex earth-sciences issue is the "correct" one.
Criterion for a Successful PSHA • When independently applied by different groups, would yield "comparable" results, defined as results whose overlap is within the broad uncertainty bands that inevitably characterize PSHA results. • For this to be true, the uncertainties in the methodology must be confronted and dealt with head-on. No PSHA analyst should attempt less, and no PSHA sponsor should accept less.
Criterion for a Successful PSHA (cont.) • Regardless of the scale of the PSHA study, the goal remains the same: to represent the center, the body, and the range of technical interpretations that the larger informed technical community would have if they were to conduct the study.
A Note about Experts and Uncertainties • Experts tend to underestimate uncertainties. They tend to act as proponents rather than evaluators. • There are several reasons why this is the case. One reason is that experts are so invested in their own model and convinced that their model is correct, they have not or will not evaluate alternative models and interpretations and all sources of uncertainties. • This process is called “anchoring”.
A Note about Experts and Uncertainties • Experts often say that we have no data or information on a certain parameter and so they avoid making the characterization. • The result is that in many parts of the world, the state of the state-of-the-practice is well below the state-of-the-art. That produces biased estimates of hazard.
Risk Analysis • Except for possibly extreme magnitudes, we know, by and large, where there will be extreme losses on a global scale: in earthquake-prone areas where there is a large concentrated population that is vulnerable because of poorly engineered buildings. • We were aware of the situation in Haiti. Past large earthquakes had previously destroyed Port-au-Prince.
Risk • What is an acceptable level of risk? Often specified in terms of probabilistic hazard • Decisions cannot be made on the worse-case scenario. • What is a worse-case scenario? Difficult to assess because of large uncertainties unless the event has occurred in the past and even then, population, inventory and vulnerability change with time. • Decisions must be based on risk because of economic and societal limitations.
Hazard Probabilities • Nuclear Power Plants – 1 in 10,000 • High Hazard Dams – 1 in 3,000 to 1 in 10,000 • Ordinary Buildings – 1 in 500 • What is the lowest probability that should be considered? • Low probability – high consequence events are difficult to mitigate for because of the trade-offs with other competing needs.
Tohoku-Oki Earthquake • In terms of predicting seismic hazard, was the 2011 earthquake considered in analyses in Japan? Apparently not but in retrospect, it should have been. • Although there was no well documented case of a previous M 9 earthquake occurring along the northern Japan subduction zone, the 869 Jogan earthquake was suggested in 2005 to have been a predecessor of the 2011 event. • Why wasn’t this possibility considered in PSHA for the Fukishimanuclear power plant?
Tohoku-Oki Earthquake (continued) • However, what if no evidence of the 869 earthquake had become available? • It might still be argued that a M9 earthquake should have been addressed by looking at other subduction zones worldwide where apparently “segmented” subduction zones had multiple segments rupturing together in a larger than anticipated earthquake, such as the 2004 Sumatra earthquake.
Ground Motion Prediction Model With Uncertainties Compared to the 2011 Tohoku-Oki Strong Motion Data
Summary • Are extreme earthquakes accounted for in modern seismic hazard analysis? More often than not. • The uncertainties in our knowledge of earthquake behavior need to be adequately included in PSHAs. • However, even then there is no guarantee that all extreme events will be recognized; there are always unanticipated surprises. • We must recognize that the results of even the best PSHAs have a limited “guarantee”.
Summary (continued) • Although stability is sought in hazard predictions, the record suggests that hazard estimates may only be stable for a decade at best. • Decisions should be and are based on risk rather than hazard because its the consequence of the hazards that we are concerned about. • However, even when extreme events and their associated hazards are predicted, decisions to mitigate the impacts from such extreme events are likely put aside because of economic and societal limitations and competing demands.