Catalyst Characterization
Catalyst Characterization. 朱信 Hsin Chu Professor Dept. of Environmental Eng. National Cheng Kung University. 1. Introduction. Physical properties: pore size, surface area, and morphology of the carrier; and the geometry and strength of the support

Catalyst Characterization
E N D
Presentation Transcript
Catalyst Characterization 朱信 Hsin Chu Professor Dept. of Environmental Eng. National Cheng Kung University
1. Introduction • Physical properties: pore size, surface area, and morphology of the carrier; and the geometry and strength of the support • Chemical properties: composition, structure, and nature of the carrier and the active catalytic components • Changes during the catalysis process: deactivation
2. Physical Properties of Catalysts 2.1 Surface Area and Pore Size of the Carrier • Surface areaPore sizePore size distributionPore structurePore volume • The size and number of pores determine the internal surface area. It is usually advantageous to have high surface area (large number of small pores) to maximize the dispersion of catalytic components.However, if the pore size is too small, diffusional resistance becomes a problem.
2.2 surface Area and Pore Size Measurements • A standardized procedure for determining the internal surface area of a porous material with surface area greater than 1 or 2 m2/g is based on the adsorption of N2 at liquid N2 temperature onto the internal surfaces of the carrier. • Each adsorbed N2 molecule occupies an area of the surface comparable to its cross-sectional area (16.2Å2)By measuring the number of N2 molecules adsorbed at monolayer coverage, one can calculate the internal surface area. • Next slide (Fig. 3.1a)BET gas adsorptin plotFlatten part: monolayerSecond rise: multiple layers
The Brunaure, Emmett, and Teller (BET) equation describes the relationship between N2 volume adsorbed at a given partial pressure and the volume adsorbed at monolayer coverage:where P = partial pressure of N2 P0 = saturation pressure at the experimental temperature V = volume adsorbed at P Vm= volume adsorbed at monolayer coverage C = a constant • Next slide (Fig. 3.1b)Linear form of the BET equationThe most reliable results are obtained at relative pressure (P/P0) between 0.05 and 0.3.
The same equipment can be used to determine the pore size distribution of porous materials with diameters less than 100Å, except that high relative pressures are used for condensing N2 in the catalyst pores. • Next slide (Fig. 3.1c)Pore size distribution measurementThe procedure involves measuring the volume adsorbed in either the ascending or descending branch of the BET plot at relative pressures close to 1.This plot shows the carrier having a significant volume of mesopores (diameters between 20 and 500Å)
Capillary condensation occurs in the pores in accordance with the Kelvin equation:where σ = surface tension of liquid nitrogenθ = contact angle V = molar volume of liquid nitrogen r = radius of the pore R = gas constant T = absolute temperature P = measured pressure P0 = saturation pressure • The form of the Kelvin equation describes the desorption isotherm, and it is the preferred one for calculation of pore size distribution. (desorption requires a lower pressure compared to adsorption)
2.3 Pore Size by Mercury Intrusion • For materials with pore diameters greater than about 30Å, the mecury intrusion method is preferred.The penetration of mercury into the pores of a material is a function of applied pressure. • The Washburn equation:where d = pore diameter, nm p = applied pressure, atmθ= wetting or contact angle, between the mercury and the solid is usually 130oγ= the surface tension of the mercury, 0.48 N/m • Next slide (Fig. 3.2)The mercury intrusion method: 30Å-106Å • the BET method: < 100Å
2.4 Particle Size Distribution of the Carrier • Sieves of various mesh sizesReliable only for particles larger than about 40μm (#400=38 μm) • Light scattering, image analysis, sedimentation, centrifugation, and volume exclusion (coulter counter)Reliable for finer particles • Laser techniques (more recently) • Next slide (Fig. 3.3)Laser-generated particle size distribution for an Al2O3 carrierF: fractionU: cumulation
2.5 Washcoat ThicknessOptical microscopy is the most commonly used method of obtaining washcoat thickness. 2.6 Mechanical Strength of a Monolith • Monoliths, particularly when used in a stacked mode (e.g., in stationary pollution abatement) must resist crushing axially. • For automobile and truck application, and for ozone abatement in aircraft, resistance to vibration and radial strength is important. 2.7 AdhesionErosionThermal shocks (start up and shutdown)
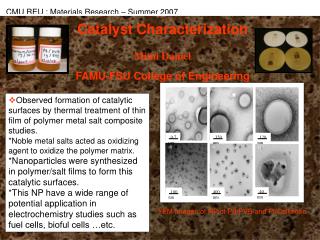
2.8 Location and Analysis of Species within the Catalyst • Scanning electron microscope (SEM) is equipped with an energy dispersive analyzer (EDX) or wavelength dispersive analyzer (WDS).The bombardment of a sample with electrons generates X rays characteristic of the elements present. • Next slides (Fig. 3.4 a ~ Fig. 3.4 d)WDS analysis for catalysts deposited on double-layered washcoats(a)(b): topcoat Pt dispersed on bottom coat SiO2(c)(d): topcoat Pd dispersed on bottom coat Al2O3
Next slide (Fig. 3.5)A electron microscope line profile of a poisoned automobile exhaust catalystP and Zn, originating from the lubricating oil, are concentrated on the edge of the washcoat indicating they physically deposited as aerosols.Gaseous sulfur compounds such as SO2/SO3, penetrate deeply and more uniformly into the washcoat.
3. Chemical Properties 3.1 Elemental Analysis • Small amounts of promoter oxides intentionally added (often < 0.1 %) can influence catalyst activity, selectivity, and life. • Carriers are derived from raw materials, which contain various impurities such as alkali and alkaline-earth compounds, if used in excess, causing sintering or loss of surface area in Al2O3. When added in the proper amount, the same impurities can enhance stability against sinterting or, in some cases, improve selectivity. • Therefore, the quantitative procedures used to analyze the composition of catalysts are important.
3.2 Thermal Gravimetric Analysis (TGA) • TGA: a useful technique to follow microscopic weight changes A few milligrams of contaminated catalyst can be loaded into a quartz pan suspended in the microbalance. A controlled gas flow and temperature ramp is initiated and a profile of weight change versus temperature is recorded. • Frequently, TGA units are equipped with a mass spectrometer so that the offgases from the catalyst can be measured as a function of temperature. • The weight-temperature profile is helpful in establishing procedures for regenerating the catalyst and other processes in the process reactor.
3.3 Analysis by X-Ray Diffraction (XRD) • Provided a material is sufficiently crystalline to diffract X rays and is present in an amount greater than 1%, XRD can be used for qualitative and quantitative analysis. • The angles of diffraction differ for the various planes within the crystal. Thus, every compound or element has its own somewhat unique diffraction pattern. 3.4 Structural Analysis: structure of Al2O3 carriers • Next slide (Fig. 3.6)XRD patterns of amorphous γ-Al2O3and α-Al2O3
γ-Al2O3: the high-surface-area, lower - temperature structureα-Al2O3: produced at high temperature and has low surface area • Amorphous: Materials with crystallites smaller than 50Å.A well-defined X-ray pattern will not be obtained. Need to be characterized by other techniques listed below.
3.5 Dispersion or Crystallite Size of Catalytic Species 3.5.1 Chemisorption • When a structure has a definite XRD pattern, it usually has less than optimum activity. This is because most catalytic reactions are favored by either amorphous materials or extremely small crystallites. • Frequently, the purpose of the preparation technique is to disperse the catalytic components to maximize their availability to reactants: % dispersion = When this is done effectively, only small crystals are present and the diffraction of X rays is minimized. • Selective chemisorption can be used to measure the accessible catalytic component on the surface by noting the amount of gas adsorbed per unit weight of catalyst.
One assumes that the catalytic surface area is proportional to the number of active sites. A gas that will selectively chemisorb only onto the metal and not the support is used under predetermined conditions.Hydrogen and CO are most commonly used as selective adsorbates for many supported metals. • The measurements are usually carried out in a static vacuum system similar to that used for BET surface area measurements. • Next slide (Fig. 3.7a)Chemisorption isotherm (monolayer coverage, 1 H per metal site) One can determine the catalytic surface area by multiplying molecules adsorbed by cross-sectional area of the site and dividing by the weight of catalyst, e.g., the cross-sectional area of Pt is 8.9Å2 and Ni, 6.5Å2.
The static vacuum technique is time-consuming. Alternatively, a dynamic pulse technique has been used in which a pulse of adsorbate such as H2 or CO is injected into a stream of inert gas and passed through a bed of catalyst. • Next slide (Fig. 3.7b)Pulse chemisporption profiles • The static method measures only species that are strongly adsorbed.The dynamic method, performed under equilibrium conditions, measures strong and weakly chemisorbed species.Thus, static techniques usually give better dispersion results.
3.5.2 Transmission Electronmicroscopy (TEM) • A thin sample is subjected to a beam of electrons. The dark spots on the positive of the detecting film correspond to dense areas in the sample that inhibit electron transmission. • These dark spots form the outline of metal particles or crystallites and, hence, their sizes can be determined. • Next slide (Fig. 3.8)A TEM of sintered Pt, dispersed on TiO2 (500Å) • Following slide (Fig. 3.9)Crystallites of Pt about 100Å in size, dispersed on CeO2
3.5.3 X-Ray Diffraction • The larger the crystals of a given component, the sharper the peaks on the XRD pattern for each crystal plane. • The scherrer equation: Where B = the breadth at half-peak height of an XRD line L = the size of the crystallites λ = X-ray wavelength θ = diffraction angle k = a constant usually equal to 1 • As the crystallite size increases, the line breadth B decreases. • Next slide (Fig. 3.10)XRD profile for different crystallite sizes of CeO2
3.6 Surface Composition of Catalysts • XRD and TEM measure the structure and/or chemical composition of catalysts extending below the catalytic surface.The composition of the surface is usually different from that of the bulk. • It is on these surfaces that the active sites exist and where chemisorption, chemical reaction, and desorption take place. • The tools available for surface composition characterization are X-ray photoelectron spectroscopy (XPS), Auger electron spectroscopy (AES), ion scattering spectroscopy (ISS), and secondary-ion mass spectroscopy (SIMS).
XPS is used more widely than the others for studing the surface composition and oxidation states of industrial catalysts. • XPS refers to the technique of bombarding the surface with X-ray photons to produce the emission of characteristic electrons.These are measured as a function of electron energy. • Because of the low energy of the characteristic electrons, the depth to which the analysis is made is only ~40Å .The composition of this thin layer as a function of depth can be determined by removing or sputtering away top layers and analyzing the underlying surfaces. • This technique can provide properties including oxidation state of the active species, interaction of a metal with an oxide carrier, and the nature of chemisorbed poisons and other impurities.