
Analyzing Data: Bivariate Relationships
E N D
Presentation Transcript
Analyzing Data: Bivariate Relationships Chapter 7
Getting Starting • Label each variable in your study as nominal, ordinal, or interval/ratio • Decide how you will present the data • Select the most relevant statistics
Contingency Tables • Often referred to as cross tabs • Study two variables simultaneously • Best for nominal or ordinal • Interval/ratio if very few categories • Size of table is defined as Row X Column • Independent variable = column • Dependent variable = row • Cells: intersections of rows and columns • When making comparisons > groups need to = 100%
Testing Bivariate Relationships • Assessing relationships between nominal and ordinal measures is done via chi-square • Can be used to test the independence of the row and column variables in a two-way table. • Use the chi-square statistic (goodness-of-fit) to accept or reject the null hypothesis that the frequency of observed values is the same as the expected frequency. • To perform this in Minitab, Select: Stat > Tables > Cross Tabulation
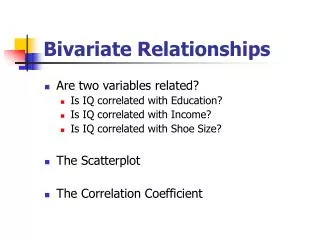
Correlation • Pearson product moment correlation coefficient measures the degree of linear relationship between two variables. • The correlation coefficient has a range of -1 to 1. • If one variable tends to increase as the other decreases, the correlation coefficient is negative. • If the two variables tend to increase together the correlation coefficient is positive. For a two-tailed test of the correlation • H0: r = 0 versus HA: r 0 where r is the correlation between a pair of variables. • Select: Stat > Basic Statistics > Correlation
Interval/Ratio Variables • Scatterplots are most common for presenting interval/ratio variables • You have choices • Just a basic plot – Select: Graph > Plot • Fitted line plot – Select: Stat > Regression > Fitted line plot • Minitab calculates a Pearson correlation coefficient. • If the distribution fits the data well, then the plot points will fall on a straight line.
Purposes of Measuring Relationships • Main goals of research • Describe • Explain • Predict • Three main purposes • To account for why the dependent variable varies among respondents • To predict future occurrences • Describe relationships among variables